We see a lot of analytics users who aren’t sure what to do beyond the very basics of monitoring their referrers and overall traffic. I myself previously worked at a company whose entire use of analytics was simply a weekly report of top referrers. Sure, that’s important data, but if that’s all you’re doing with your analytics, then you’re missing out on the vast majority of insight you should be gaining.
So what are the first steps you should take to benefit from your analytics?
Assuming you have properly set up your tracking and integrated any outside tools, there are several ways you should start using your analytics ASAP — and they won’t take much of your time. Whether you're looking for SaaS analytics, product analytics, website analytics, or marketing analytics, this article is for you.
Start with Easy Wins
Set Up a Funnel
The phrase “Funnel Analytics” might sound scary, but it’s actually a simple concept. A funnel is just the series of steps users take to reach a final goal. That’s it. Funnel Analytics will tell you at which steps users are dropping out of the funnel. This helps you find the areas that need improvement so you can get more people to that final goal.
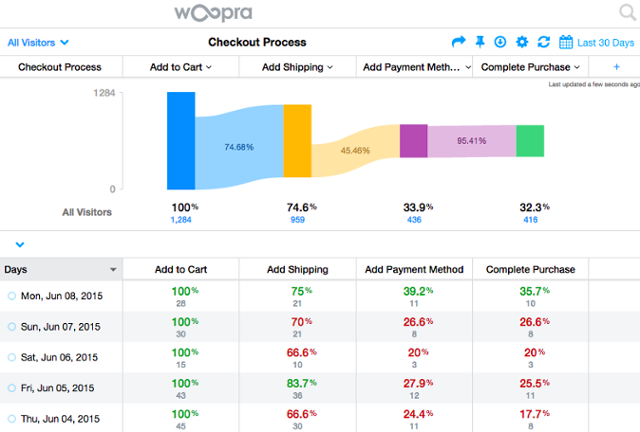
For example, let’s say our goal is “checkout”. The Funnel Analytics report below shows us 32.3% of users who add a product to their cart ultimately make a purchase. So what happens to the ones that don’t? Our report shows us that we are losing most of our customers at the “Add Payment Method” step, where more than half of them drop out of the funnel. We now know that this is the step causing the most friction, and we need to make improvements here.

Pretty simple, right?
Since conversions (i.e. getting people to the final goal) are extremely important to every company, one of the first things you should do is set up a Funnel Analytics report.
In a nutshell, all you need to do to set up a basic Funnel Analytics report is:
Define your goal — What is the final goal you want to get users to? It could be completing a purchase, signing up, or any other conversion.
Define your steps — What steps do users have to take in order to reach your goal? The more granular the steps, the better, as this will help you really pinpoint problem areas.
Run the report — Now all you need to do is run the report and analyze the results. You will quickly see how many users make it from one step to the next, allowing you to identify the main areas where users are dropping off.
For a more in-depth tutorial, check out this seven minute video:
Set Up a Retention Report
While funnels help us learn how to better acquire new customers, retention reports help us learn how to better keep existing customers. This is extremely important as it’s X more expensive…
Retention Analytics reports tell you how long customers continue to do a certain action. For example, how long do customers continue to make purchases?
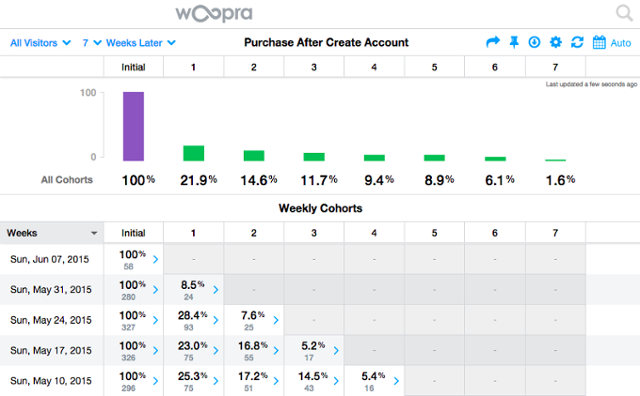
You can also use Retention Analytics reports to tell you how long customers continue to do a certain action after doing a different initial action. For example, how long do customers continue to make purchases after creating an account? The screenshot below tells us that of users who created an account, 21.9% of them make a purchase one week later, 14.6% of them make a purchase two weeks later, and so on.

Here’s the quick rundown on how you set up a basic Retention Analytics report:
Define your initial goal — This will essentially define the segment of users you are measuring. For example, if you set the initial goal to “create account”, then you will only measure the retention of users who created an account.
Define your “then” goal — This is the action you want to measure. You will see how many users continue to repeat this action over time.
Run the report — You’re now ready to run the report. You will see how long users continue to perform your “then” goal over time, ultimately helping you understand how well you are retaining users.
For a more in-depth tutorial, check out this three minute video:
Want more ideas? Here is a list of nine analytics reports to measure right now.
Leverage Your Data
Where it gets really exciting is when you use data to drive your entire customer experience. This may sound scary, but even here there are some easy wins:
Set up Notifications — You can receive real-time Notifications on important use activity. For example, your support team can receive a Notification whenever a user experiences an error. Or, your sales team can receive a Notification whenever a user demonstrates strong buying signals.
Update email lists — Use one of our many email and marketing automation integrations to automatically update our lists when users behave in a certain way.
Customize content — Personalize the content you display to different users based on how they have interacted with you. Use our Optimizely integration to start customizing content without writing any code.
Prioritize tickets — You can automatically prioritize your help desk tickets based on user behavior. For example, you can automatically give all users who are top spenders and engage with you on a weekly basis “urgent” priority. You can easily set this up using our Zendesk and Freshdesk apps.
You can implement the above strategies and many others using the dozens of integrations available in AppConnect. Most are completely code-free, so it’s easy for anyone to get started.
You have a lot of valuable data right at your fingertips. Every day you’re not making use of it is a day you could have been making more sales, delivering a better customer experience, and gaining deeper insight into user behavior.
If you have questions or need help setting up your funnels, reach out to our support team any time by emailing support@woopra.com.


