“How are my customers doing on their journey with our brand?”
This is one of the most asked questions by marketers when gauging customer experience and tracking marketing performance.
The customer journey is the path of customer interactions and engagements, made up of various touchpoints that each existing or potential customer has with a brand.
A successful customer journey can lead to conversion and sales, whereas an unsuccessful one can lead to the loss of a customer.
To measure how successful a customer journey is, brands can rely on customer journey analytics tools. Here are the 14 metrics they should track, analyze, and optimize.
1. Website Visits
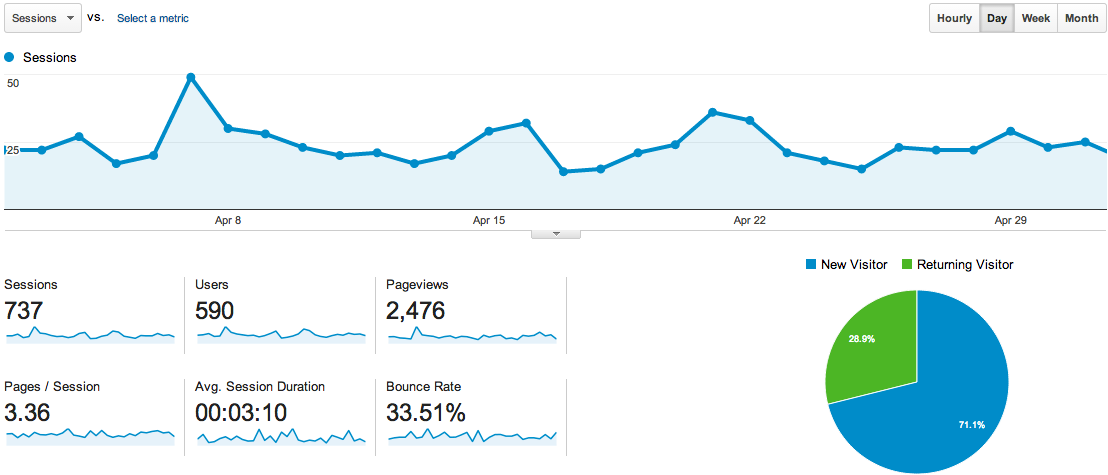
As a customer journey analytics metric, website visits or sessions refer to the total number of times a user navigates to a website and any of its pages.
 Source: Flight Circle
This is one of the most basic metrics in customer journey tracking as it shows a visitor’s intention to learn more about your company and product.
To make sure the visit was intentional, analytics tools generally only add towards the website visit count instances in which at least one web page has loaded.
Closely related to this customer journey mapping metric are clicks, which represent the number of clicks a visitor makes on any given web page of your website, and sessions, which measure the length of time the visitor spends on your website.
These are all customer behaviors that are telling of customer satisfaction with the web content and overall user experience.
2. Page Scroll Length
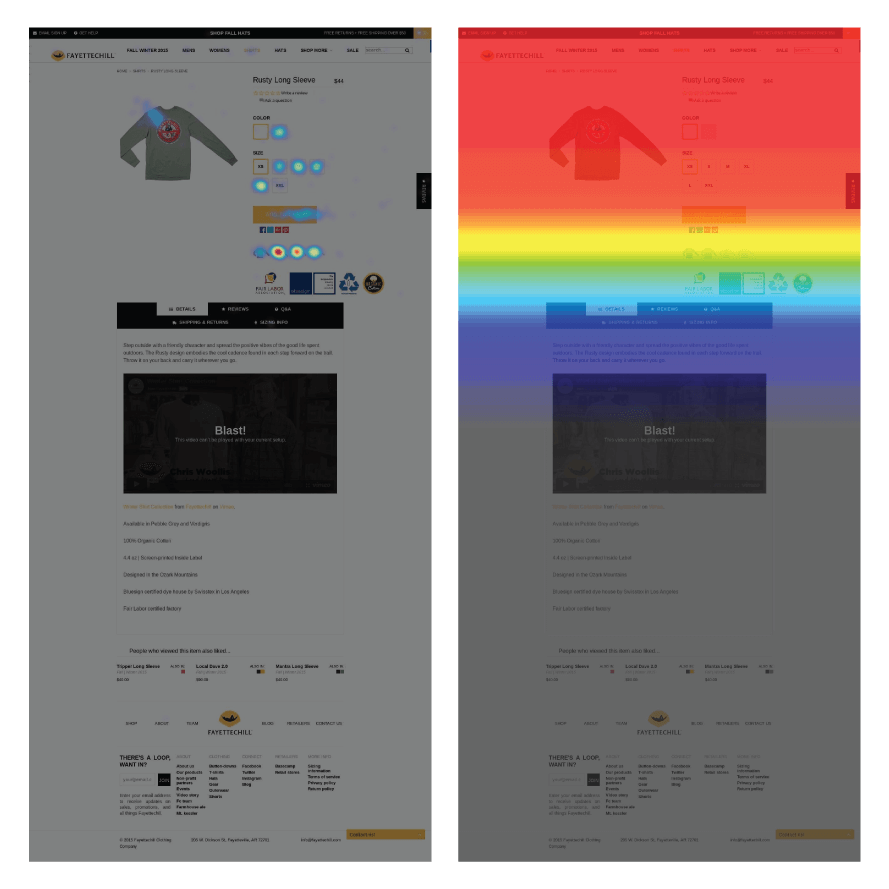
The page scroll length is the distance that a user scrolls down a web page.
 Source: The Good
Sometimes referred to as “scroll depth,” this customer journey tracking metric is a good indicator of interest and engagement, with a longer length typically indicating that website visitors are spending more time reading the content of the page.
While anything above the fold is automatically visible to the visitor once he or she enters the page, anything below requires the conscious effort of scrolling down to see.
By tracking the page scroll length of key website pages, such as the homepage and product pages, marketers can measure interest in their brand and products and make the appropriate adjustments to the B2C or B2B customer journey to further optimize brand awareness and knowledge.
And this can be a huge help in optimizing customer journey mapping.
3. Conversion Rate
When mapping out the customer journey, marketers assign different goals to each stage of the customer journey.
Each goal is tied to a customer touchpoint on the customer journey map, and a conversion takes place when a goal is achieved.
The conversion rate, therefore, measures the number of users who completed the desired action or the designated goal as a percentage of the total number of users who reached the touchpoint.
Also Read: Customer Retention Metrics
For a customer journey map example, if the goal of this blog post is to get readers to click on the call-to-action button, the conversion rate is the number of readers who click divided by the total number of readers.
Since the best customer journeys have a number of touchpoints, a conversion can refer to several different completed goals. These can be a like, click, sign-up, response to an email, or a purchase.
Check out Woopra’s list of 7 interesting real-life customer journey map examples to learn more about customer journey mapping, customer journey mapping tools, touchpoint tracking, conversion tracking, and marketing automation.
4. Cost per Conversion
A related customer journey mapping metric to the conversion rate is the cost per conversion.
As its name suggests, the cost per conversion is the amount of money spent to generate a desired action or conversion.
 Source: Digital Delane
In marketing, common forms of cost per conversion (CPC) include cost per impression, cost per click, and cost per lead.
CPC is a measure of campaign performance, with a lower cost signaling that the marketers behind the campaign are doing something right and getting people interested without spending too much money.
When the CPC is unusually high compared to previous campaigns or industry benchmarks, that is also telling of the campaign performance — namely, that the campaign, be it the content or the marketing channel it’s running on, is not resonating with its intended audience.
High or low, the CPC, like many of these customer journey mapping metrics, is a source of actionable insights that can help companies optimize their marketing campaign, minimize customer pain points, and enhance customer journey management.
5. Sales
The one customer journey analytics metric everyone in business knows is sales.
Sales is the number of products or services sold to customers during a given period of time.
Whether you are a B2B company or a B2C company, whether you sell products or services, sales are important in any industry.
Sales, as a metric, not only directly assesses business performance, but also indirectly reflects how your company is doing in terms of understanding customer needs and meeting customer expectations.
6. New Customer Revenue
New customer revenue is the total amount of money generated from a business’s new customers.
The counterpart to this customer journey analytics metric is existing customer revenue.
Both are important to a company, but we are highlighting tracking new customer revenue because it allows marketers to understand the effectiveness of their marketing strategy.
A key goal of marketing is to raise brand awareness and elicit customer interest in the brand’s product or service.
New customer revenue is a metric that can highlight the number of new customers that your company is bringing in through its various marketing efforts and the dollar value these new customers contribute to your overall business.
7. Customer Lifetime Value
Customer lifetime value (CLV) is a measure of a customer’s total monetary worth to a business over the entire course of the customer relationship.
In layman’s terms, CLV is how much a customer is expected to spend on products or services by a company.
CLV is an important customer journey analytics metric for brands to fully understand and keep track of because it will influence a number of their decisions regarding where to put marketing dollars and which customer segments to target aggressively.
The typical formula to calculate CLV is:
_Average Purchase Value x Average Number of Purchases per Year x Average Customer Lifespan _
However, to precisely gauge CLV, businesses are better off tracking customer behavior predictive and customer analytics that use existing customer data to generate more accurate predictions about customer behavior and value.
8. Retention Rate
The user journey does not end when said user converts to a customer. If anything, that is only the beginning of what brands hope to be a long-lasting customer relationship.
Retention in customer journey tracking refers to the ability of a business to keep its customers over a specific period of time.
As a customer journey map metric, the retention rate is the percentage of customers who continue paying for a product or using a service over a given period of time.
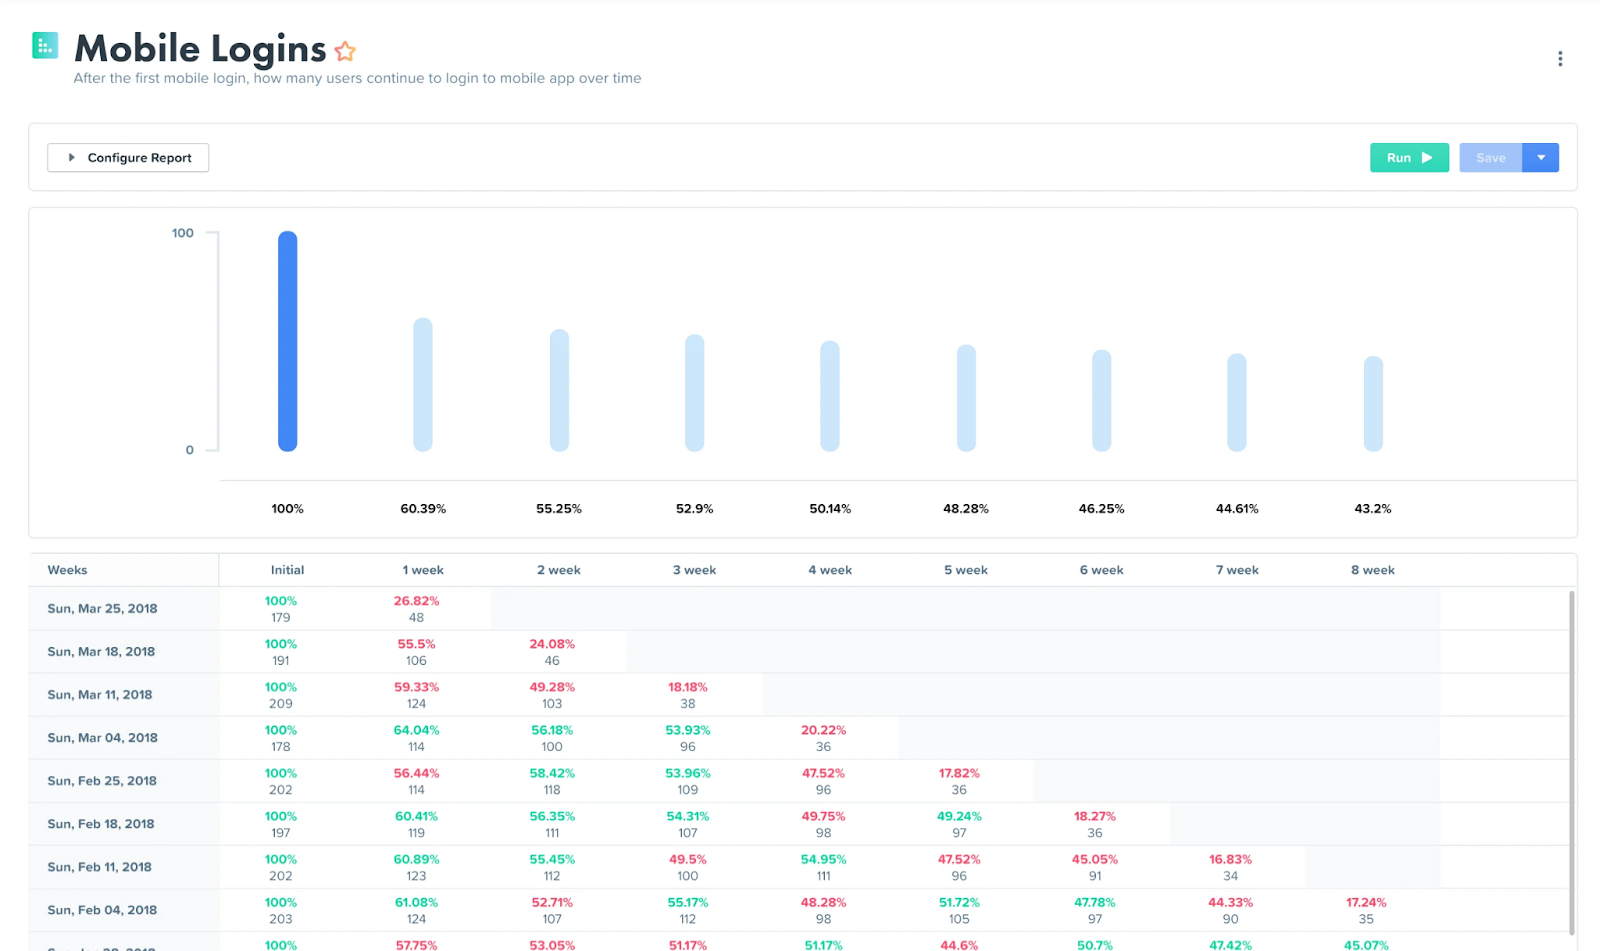
Retention is just as important as customer acquisition, as it determines the sustainability and longevity of a business.
A high retention rate is a good indicator of high customer satisfaction and customer loyalty, whereas a low retention rate is a sign of trouble that should alarm businesses and get them to review and change their strategies.
Optimize for Conversion & ROAS Now! Explore Woopra in a demo and enjoy a 2-week free trial: https://www.woopra.com/demo
9. Churn Rate
The opposite of the retention rate is the churn rate, which is the percentage of customers who stop paying for a product or using a service over a given period of time.
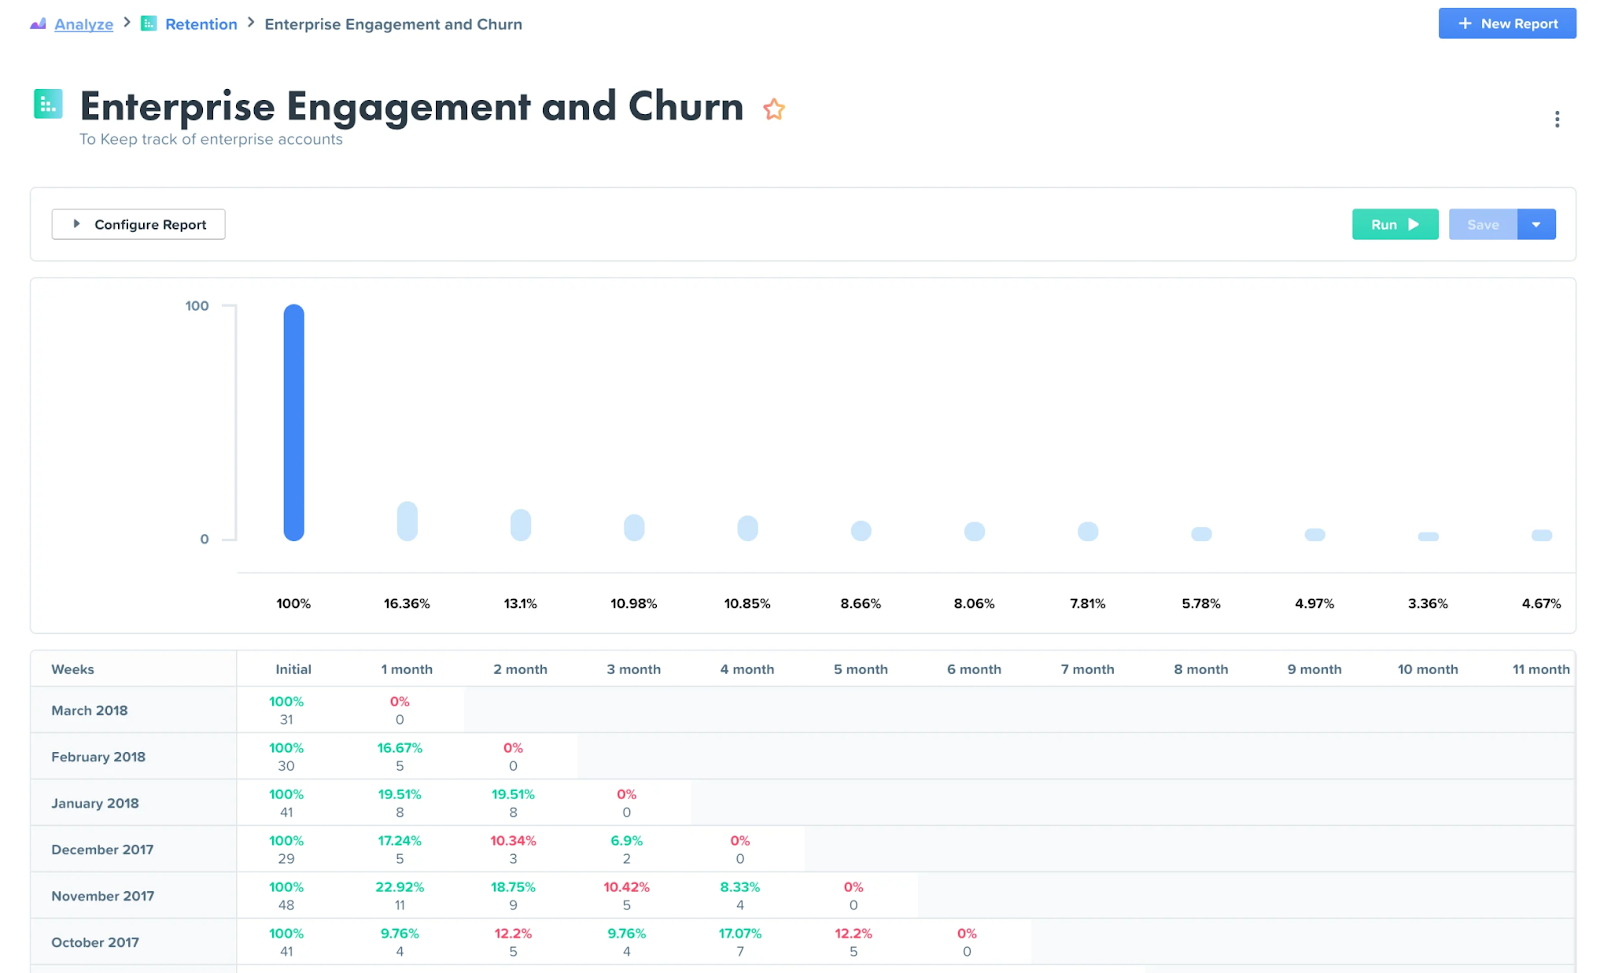
Customer churn, also known as customer attrition, is important to track with a customer journey mapping tool because, like customer retention, it is very telling of the overall customer experience with a brand and its products and services.
There are many factors that can contribute to a high churn rate which may or may not have anything to do with the product or service your business offers.
These factors include poorly designed products that result in a high customer effort score, low-quality customer service, and a lack of customer service to ensure customer success.
This is why businesses should look at churn rate in conjunction with a number of the customer journey analytics metrics we highlight in this blog post when engaging in marketing analytics — to get the full picture and understand what needs to change.
10. Net Promoter Score
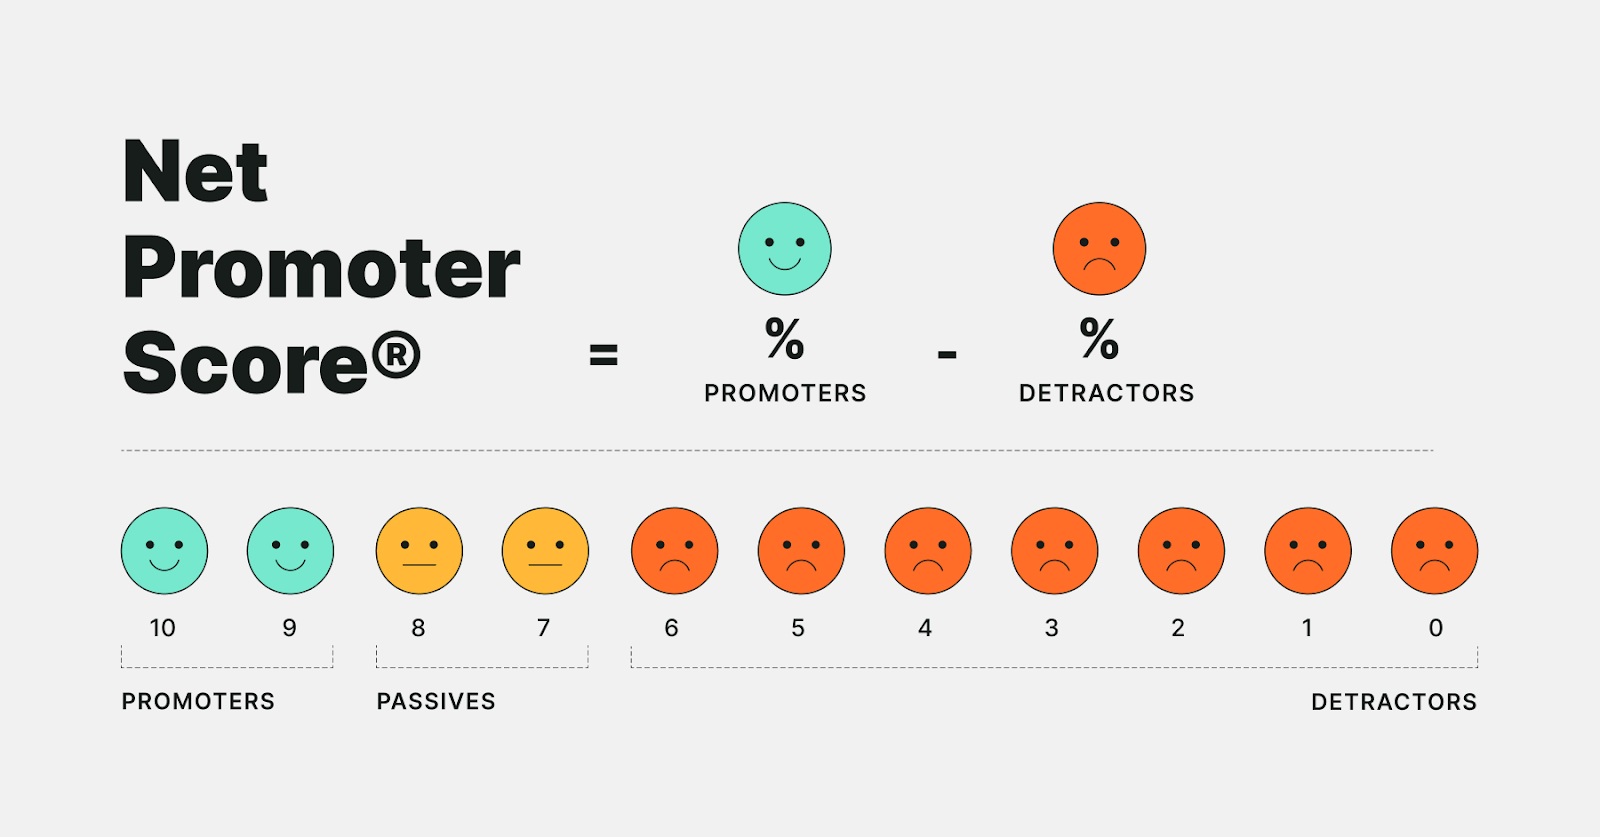
Net promoter score (NPS) is a customer experience management metric that measures the results of a single customer survey question: how likely is a customer to recommend a company’s product or service to a friend or colleague?
Customers answer on a scale of 1 to 10. Those who respond with a score of 9 or 10 are considered “promoters,” those who respond with a score of 0 to 6 are considered “detractors,” and those who respond with a score of 7 or 8 are considered “passives.”
 Source: mTab
Once customers have answered this question, the NPS is calculated by tallying up the responses and subtracting the percentage of detractors from the percentage of promoters.
NPS with customer journey mapping tools is a key measure of customer experience, satisfaction, and loyalty.
In an age when word-of-mouth advertising has a large influence over customer decisions, NPS is one important way to understand how your customers view your products or services and your overall reputation in the market.
11. Customer Satisfaction
Brands often employ customer success managers (CSMs) to support their customers in using their product or service and foster a positive customer relationship.
In order for these CSMs to fully understand if customers are satisfied with the company and its offerings, they may send out a customer feedback form to learn more about the quality of each customer interaction.
An easy way to measure customer satisfaction in these feedback forms is by asking the question directly: how satisfied are you with the company’s products or services?
With these customer journey mapping responses, CSMs can calculate a customer satisfaction (CSAT) score and work on improving it.
The CSAT score is one of many scores and responses that inform the overall customer health score, which CSMs use to determine whether a customer is healthy or at risk of churning.
12. User Engagement
User or customer engagement in customer journey analytics is a measure of how your customers interact with your product or service as well as you as a brand.
It is an overarching term that encompasses time spent, frequency, and level of engagement with a brand, its product, website, app, social media, and other marketing channels.
Even a call to a customer service contact center is a form of user engagement, and when it comes to engagement, quality, and timely responses, it is important.
As a customer journey analytics metric, user engagement can provide insights to brands on how effective their products or services are in meeting customer needs and assist in highlighting areas for improvement.
Boiled down to its core, user engagement is a measure of how valuable customers find a product or service, which is something all brands want to know when using customer journey mapping tools.
13. Return Rate
Return rate, also referred to as the “repeat visit rate,” is the percentage of users who return to a mobile app, software product, or website over a specific period of time.
The benchmark for a good return rate depends on the industry, but it is safe to say that the higher the return rate, the better.
The return rate is an indicator of customer satisfaction and loyalty, and when customers continue to return to you, it means that you are providing them with value.
14. In-App Purchases
While this metric may only be applicable to some, in-app purchases refer to the buying of additional content or features within an app.
A common example is gamers spending real money to buy an extra life or a new power in a gaming app.

Source: Leanplum
Not only are in-app purchases a good source of revenue for app companies, but they are also a good indicator of customer behavior and engagement.
In the gaming app example, only users who are truly invested in the game would spend actual money on something they can only use inside the game.
As such, in-app purchases can inform brands of customer engagement and customer health, which can be greatly helpful for overall customer journey mapping.
Bottom Line
If you are looking for one customer data platform that can track all of these important customer journey metrics and help you with customer journey optimization, look no further than Woopra.
It can track the entire customer journey from start to finish and provide you with a wealth of customer data.


