Marketers are constantly searching for ways to improve their campaigns. The good news is that there is more data at their disposal than ever before. The bad news? There's so much data out there that it can be difficult to find actionable information when you need it most.
Although your website may experience a fair amount of traffic, keeping visitors engaged and maximizing conversions can be challenging. Spotting where your website users are leaving can help you identify pain points and increase conversions.
Funnel analytics are an excellent way of solving this problem for your business by providing valuable insights into how your marketing efforts are performing. They can tell you a lot about your audience and how they react to different stages throughout the buyer journey.
Funnel analysis are also a valuable feedback tool for marketers looking to maximize their campaign and make better data-driven decisions. In this article, we'll dig in on how you can leverage funnel analytics to make better marketing decisions with Woopra.
What is Funnel Analysis?
Funnel analysis uses a variety of metrics to help you understand how visitors flow through a series of conversion funnel pages on your website. Close in comparison to customer journey analytics, you'll be able to map and forecast your key marketing channels while learning exactly how your website visitors engage with your business at each stage of your funnel.
Here’s a simple example of funnel analysis in action.
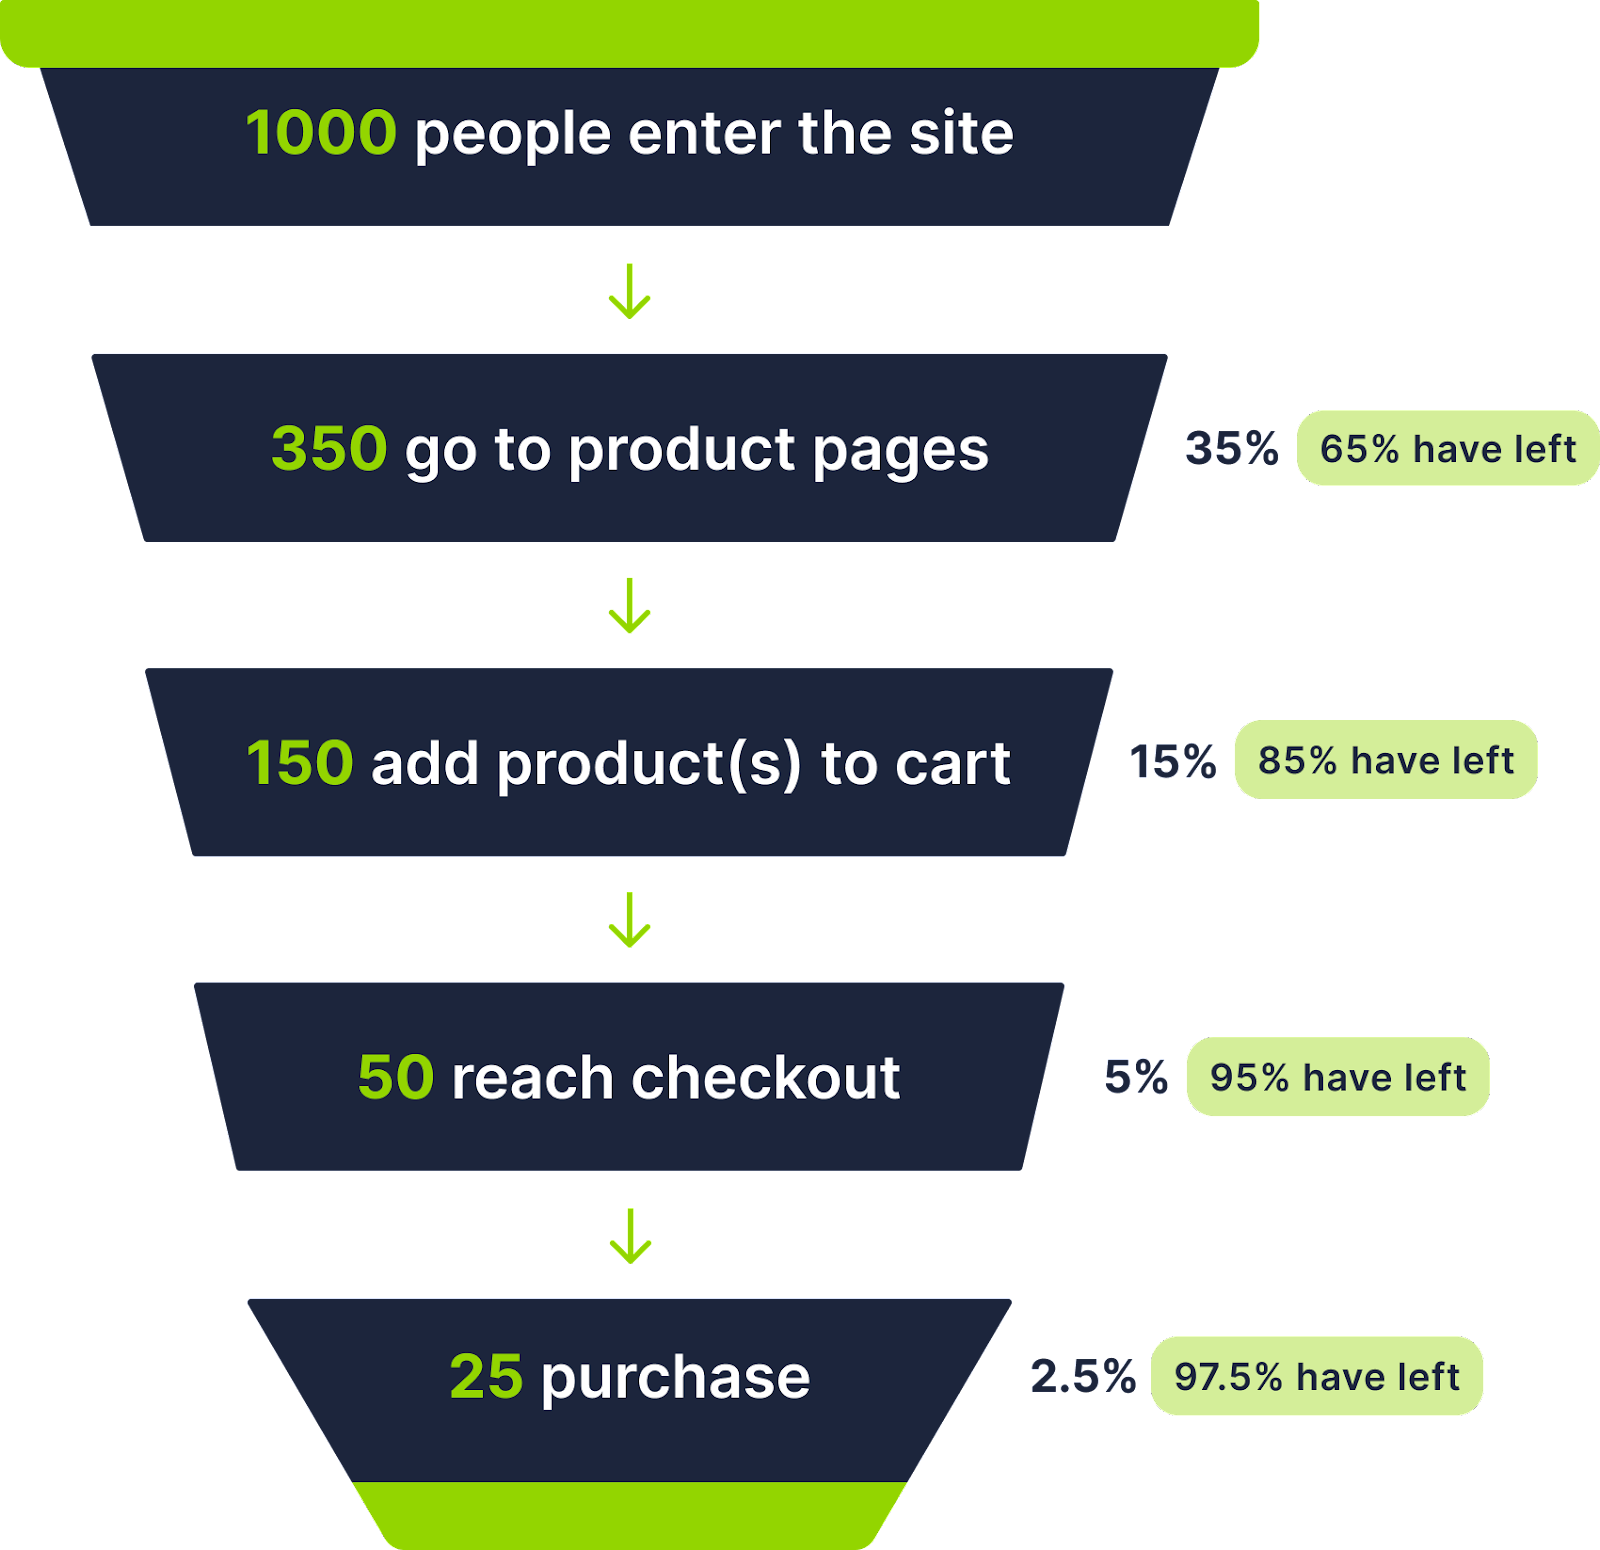
Source: Daasity
A sales funnel visualization tool can help you identify hidden problems that may be acting as conversion barriers and cause potential customers to leave your site before taking action. Marketers can use the data from these funnels to maximize the potential of their campaigns, increase revenue, or create an enhanced website experience.
If your website traffic only produces a small percentage of user conversion, a funnel analysis report could be just the solution you need.
How Funnel Analytics Can Help Your Business
Some marketers may feel tempted to rethink their entire website in an effort to increase their funnel conversion rate. This is where data integration tools and funnel analysis can improve the efficiency of this process by helping them better understand which areas of their website need the most work.
Funnel analytics can help solve this problem by identifying high exit pages where visitors are most likely to leave.
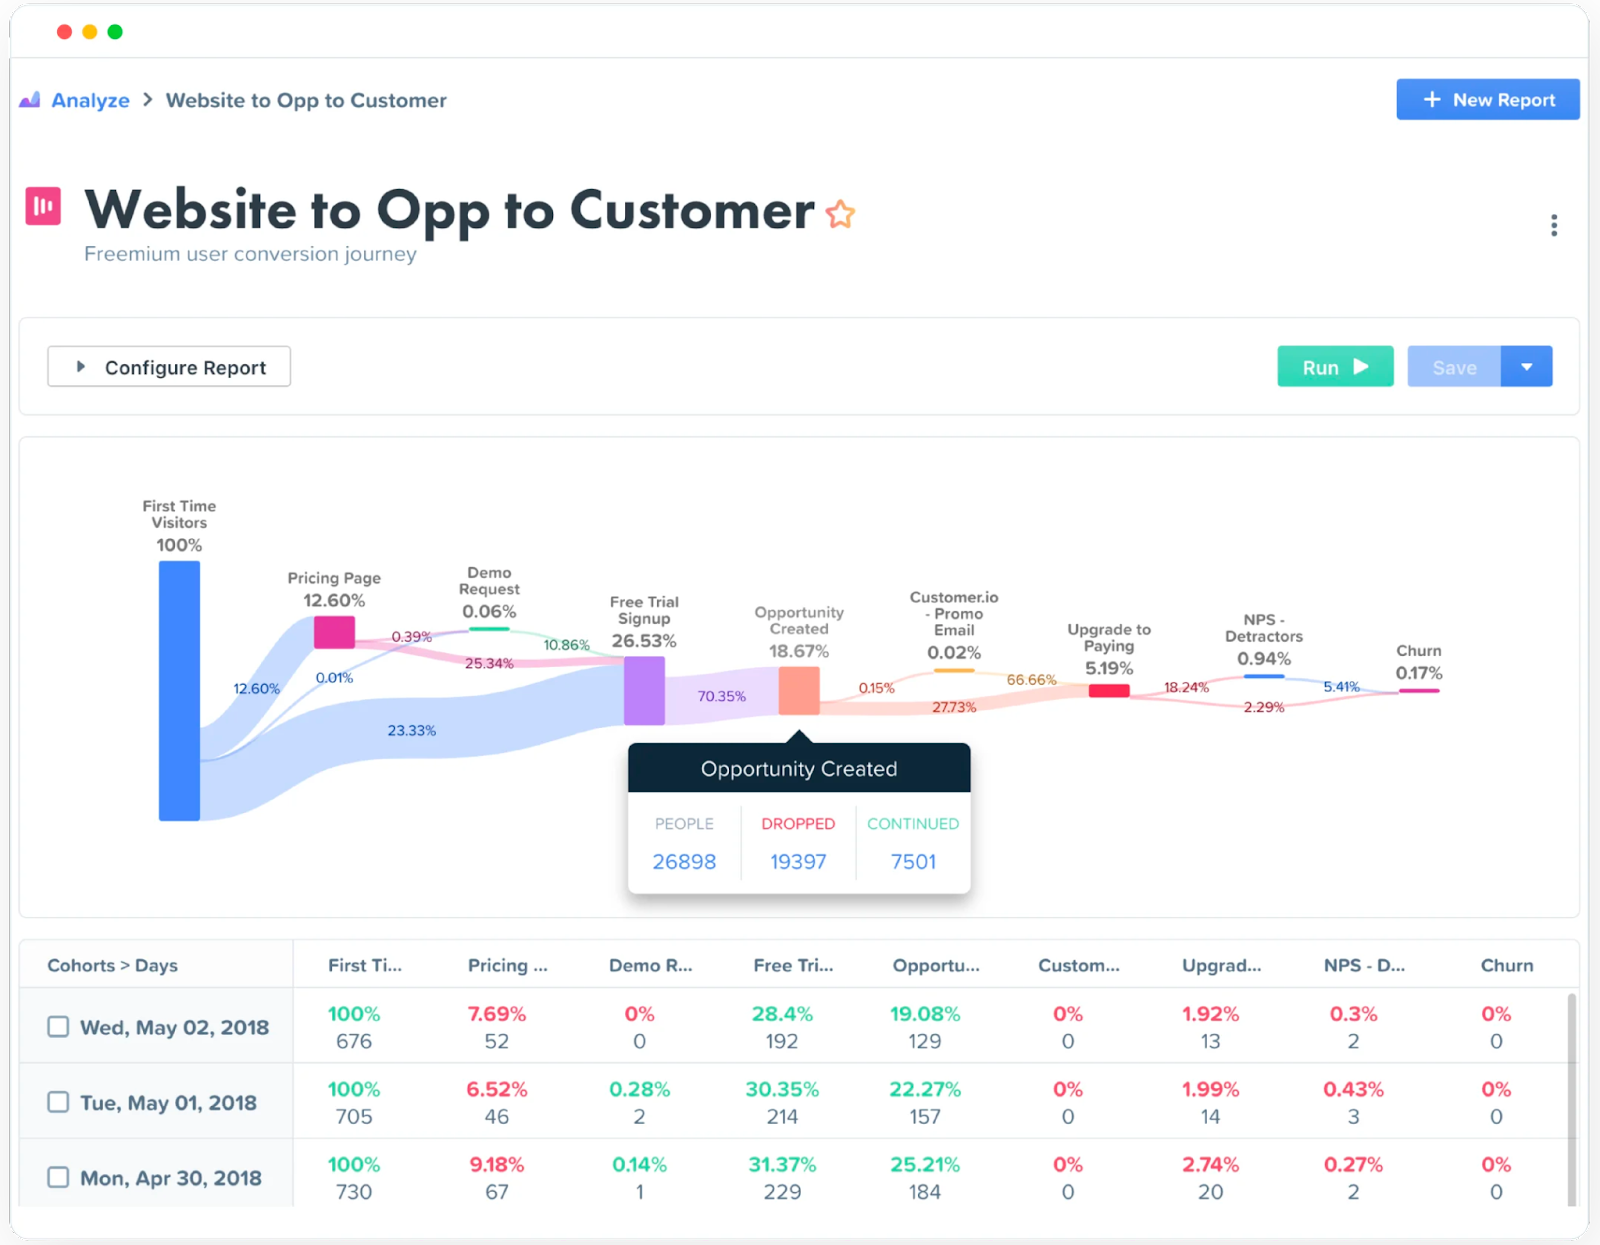
Source: Woopra
There are several ways to gauge the effectiveness of your campaigns, such as a trended funnel or goal flow report. However, by complimenting that data with funnel analysis, you're gaining valuable customer intelligence, which may increase the likelihood of finding these potential barriers.
Funnels can also identify where your website strategy is succeeding. A funnel visualization tool will show you the traffic source and high-performing pages that are bringing you success.
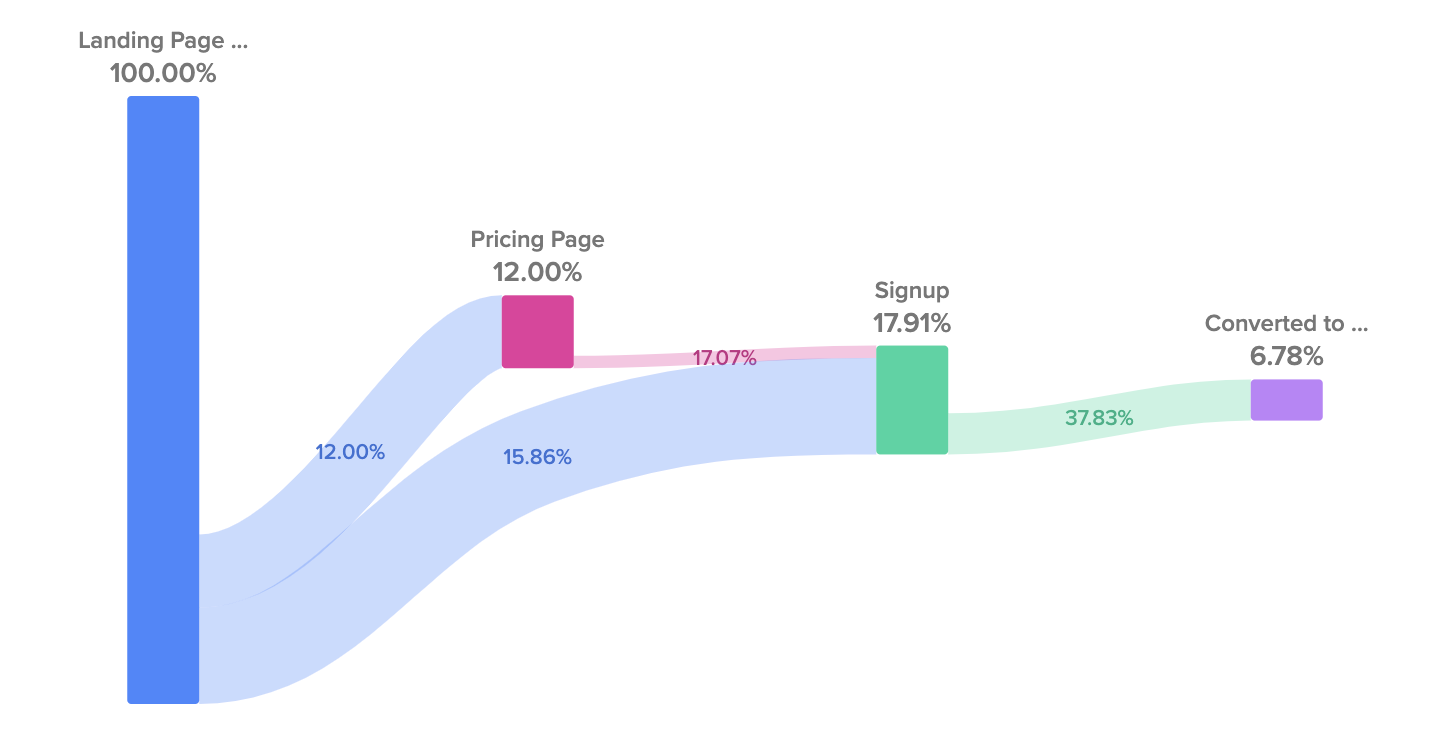
Source: Woopra
By knowing which parts of your funnel are doing well, you'll be able to focus your efforts on the channels that are the most likely to lead to a positive outcome.
Funnel analytics also enable your team to share insights with shareholders on how your marketing efforts are bringing the business success. Woopra provides you with all of the required tools to get started with your analytics funnel and determine which steps users are dropping out at.
How to Use Funnel Analytics
As we mentioned before, the primary purpose of funnel analytics is to identify high-exit pages that are creating issues, as well as the areas in which your current funnel is succeeding.
But to go a bit more granular, you can use this type of web analytics to thoroughly analyze user behavior at each step in the funnel.
With it, you can pinpoint overarching trends, starting from the moment a website visitor first lands on your site to the moment they make a purchase.
By “zooming out,” you can gain an objective perspective of how visitors are interacting with your site so you can determine what’s working and what’s not.
From the data you gather through conversion funnel analysis, you can then develop strategies to optimize the user experience.
For example, you can address specific friction points in your sales funnel, improve navigation that may be causing excessive drop off, enhance calls-to-action, and more.
Whatever the case may be, you’ll be armed with the data needed for full-scale conversion funnel optimization that should significantly improve the customer experience and increase your conversion rate.
And in the long run, you can use funnel analytics to make continual, iterative improvements to your website and overall sales funnel.
Note that user shopping behavior can change over time, and there are an endless number of variables that can affect your funnel’s performance.
As long as you consistently analyze the data generated through Google Analytics funnel analysis, Gainsight PX analysis, or any similar funnel analysis tool, you should always have a clear understanding of visitor trends and can make ongoing improvements.
How to Conduct a Funnel Analysis
A sales funnel analysis is an effective tool to measure customer-related data and is commonly used for conversion optimization or gauging the performance of your marketing campaign.
A well-constructed funnel analysis will offer actionable insight that can help marketers understand why the visitor left their funnel and pinpoint the reason why.
The strategy behind funnel analytics focuses on specific stages throughout your funnel and identify which aspects reliably lead to conversions and which ones need improvement.
Lead funnel analysis can be utilized to identify precisely where your visitors are dropping off and find opportunities for improvements accordingly.
You can often improve your conversion funnel by making changes based on this data and running some A/B tests at the problem stage in the customer journey.
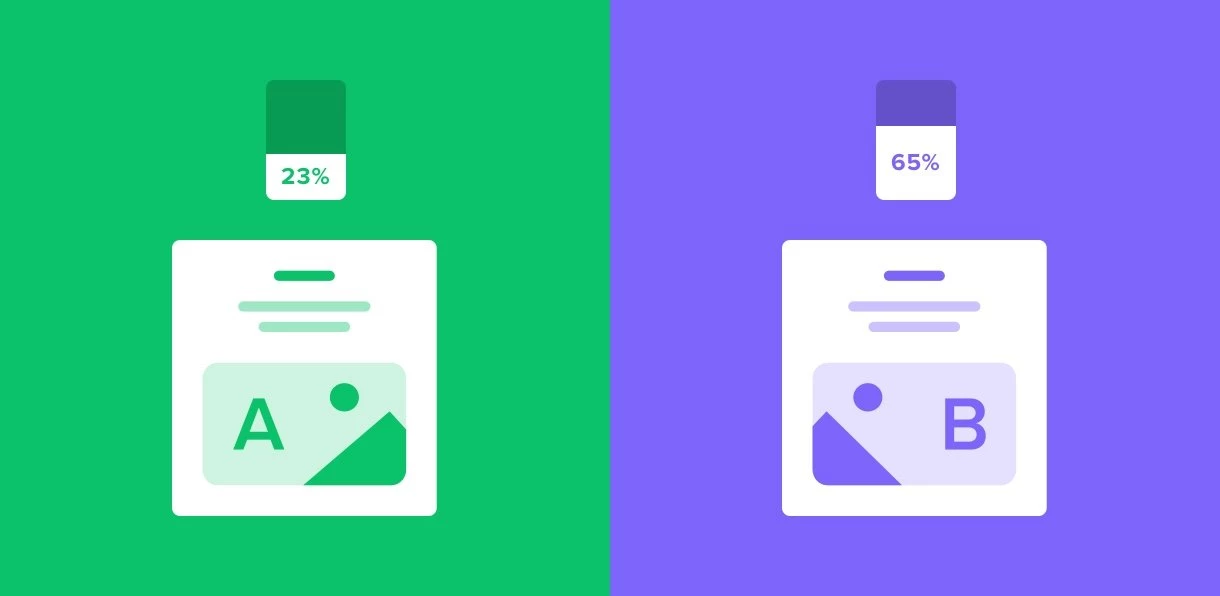
Source: MailerLite
By leveraging funnel visualization, marketing teams can easily compare a multi channel funnel to one another to search for patterns or anomalies. By visualizing your funnel analysis, you can simplify how you identify which metrics to focus on and forecast the changes that are likely to have the most significant impact.
An example of one of the common comparisons that might be used when visualizing a funnel might be differences between first-time visitors vs. returning visitors. Often, returning visitors are more likely to leave further down your funnel, while first-time visitors may leave earlier on.
While both stages will require further investigation, a funnel analysis is an excellent starting point for determining the flow at the end of a funnel and figuring out the scope, purpose, and character in the conversion path. This allows marketers to allocate resources and reshape their funnel more efficiently.
Identifying Drop Off Points
Once you figure out where the drop off occurs, you'll have to take an unbiased approach to solve the problem from the perspective of your visitors.
This can be as simple as navigating through the funnel on your own in search of anything that may turn you off as a potential customer.
Common issues that can result in higher drop-off rates include requiring a signup or registration, cluttered or complicated page designs, poorly designed user interface or a lack of clear direction to proceed.
Funnel optimization should be structured around the actions you want your website visitors to take at each crucial point in the funnel.
You should try to limit potential distractions, be sure that your call to action is straightforward and ensure your business website has a responsive web design so it can be easily accessed on all devices.

Source: Blue Corona
Funnel Visualization Reports
Funnel visualization tools are a great way to analyze unique user behavior at each stage quickly and efficiently. Visualizing your data with a funnel chart, pie chart, or makes the information easier to understand and will simplify your customer analytics.
To create a funnel visualization report, you’ll need to have a goal or objective in mind. Ultimately, your destination goal should consist of a specific page that you want to push your traffic towards. When a visitor lands on that web page, you'll have achieved your destination goal.
Dividing objectives into destination goals helps break down the steps that a visitor needs to take for a conversion to occur. These steps appear on funnel visualization reports as data recorded data telling you how many visitors end up making it to that page.
Funnel reports are easy to spot, as they generally look like an upside-down pyramid, visualizing traffic from the first destination goal to the percentage of those who actually convert.
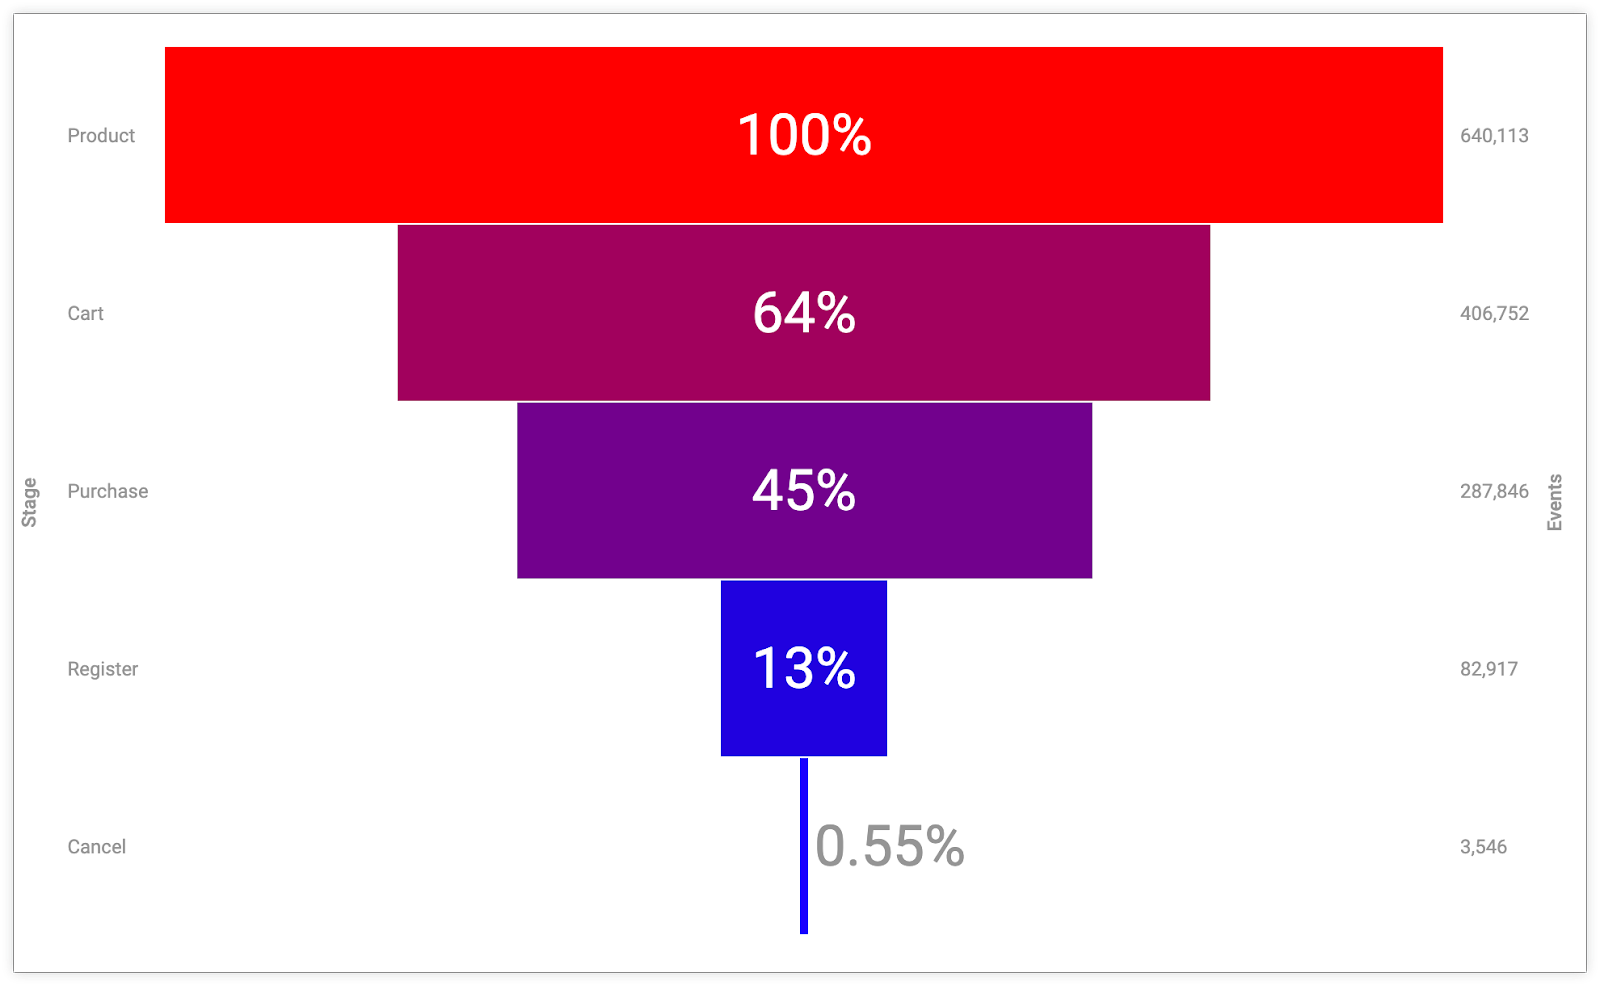
Source: Google Cloud
Before beginning a funnel analysis, you'll need to identify the specific pages that will serve as a funnel entry point as well as the other stages throughout the buyer journey. A common entry point could be that of a blog post/article, landing page, product page, or recommendation page, to name a few.
Regardless of how many entry points your funnel has, the funnel visualization report's path should follow a single step-by-step structure.
Visitors should be required to follow each funnel step from a single entry point to a single destination goal, or your data may not be accurate.
Funnel visualization reports can simplify the process of pinpointing problem areas throughout your site. You can visualize the exact page where visitor data drops off, which enables you to focus your efforts on improving the aspects that could be contributing to that drop off.
Common Funnel Analytics Issues
Funnel analytics are crucial to your digital marketing efforts, but you can't get the most out of them if they're not set up correctly. It's important to avoid common pitfalls with funnel analysis that could hinder your results. Here are a few common issues that you could potentially encounter.
Technical Errors
A custom funnel can be complicated and tedious to configure. Goal tracking errors such as an invalid or misplaced link will result in bad data sets that skew your results.
Eliminating backdoor links will help ensure that only potential customers who follow the funnel reach the goal page.
Omitted Pages
Omitting a page from your funnel can also be problematic. Unaccounted steps can allow users to leave your website without precise data regarding where they dropped off or why.
These issues are generally easier to identify than other technical problems since they'll result in a noticeable percentage of the unaccounted number of visitors moving through your funnel.
Issues with Your Payment Gateway
If your users frequently drop off at the final step but still somehow make their way to a "thank you" page, it's possible that your payment gateway could be skewing your data.
If you're using a third-party payment service, visitors will have to leave your website to pay. Which may result in a miscount of conversions if this hasn't been adequately accounted for. Payment gateways can mess up your goal funnel data if you don't include the third-party URL in your conversion funnel analysis.
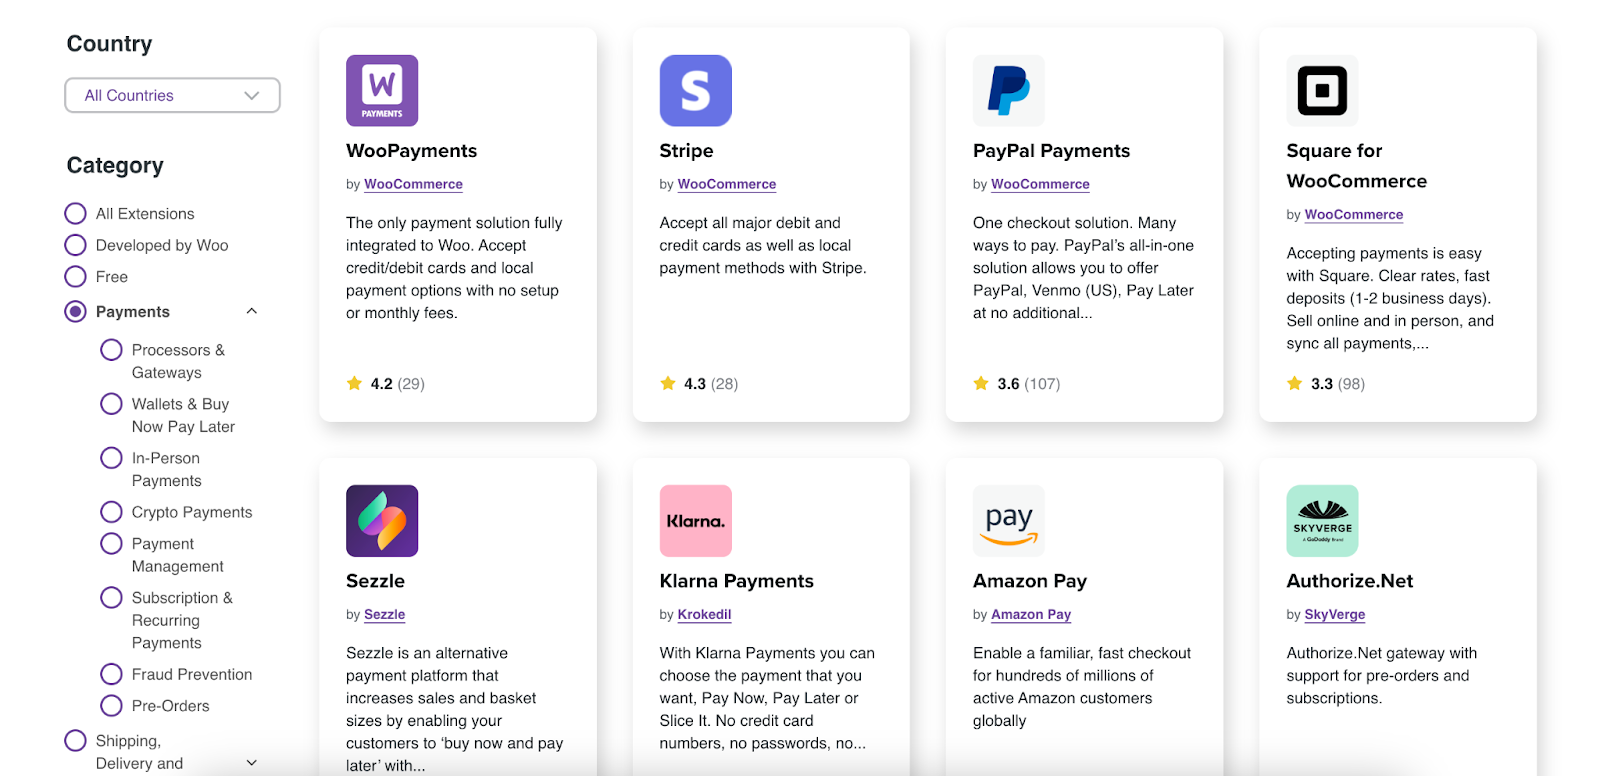
To avoid this problem altogether, you could integrate the payment provider with the eCommerce platform your website is built on. This way, your visitors stay on your website through the final checkout funnel stage.
If you’re a WooCommerce user, for example, you can find a list of payment provider integrations here.
Source: WooCommerce
Putting These Strategies to Work
Your conversion funnel is the process and the end goal that occurs throughout your visitors' user journey when acquiring a product/service. Suppose you want to explore ways to leverage data to get the most out of your marketing campaign.
In that case, you will likely need to go beyond standard page view, audience or traffic acquisition reports available in your Google Analytics account.
There are several key metrics to consider, including the design/structure of each funnel page, checkout behavior and the conversion path. It's imperative to be sure you are capturing the correct data for your funnel report as your users move from the initial stage in their journey till the very end.
Usually, this would require the configuration of a custom event at each step. Luckily, Woopra makes it as easy as ever to create custom metrics and augment customer journey data with features like formulas!
Utilizing a funnel analytics tool to drive your marketing decisions is one of the most powerful ways to improve your website's conversion rate. By gaining a quantitative understanding of your site's traffic, you'll be able to prioritize changes that can lead to the most significant impact.
A funnel visualization report is a straightforward tool to demonstrate the effectiveness of your marketing campaigns, while a funnel analysis can help your strengths and weaknesses of your website.
Summary
Funnel analytics are an essential part of digital marketing. They allow you to see where your potential customers fall within your desired goal flow and enable you to track and measure conversion rates for each step on that path.
Knowing where customers come from, what content they consume along their journey, and how much time it took them to reach a conversion point will give you valuable information about which tactics will be the most effective for future campaigns.


