Companies in the subscription economy live and die by their ARR (Annual Recurring Revenue), MRR (Monthly Recurring Revenue), ACV (Annual Customer Value), and LTV (Life-time Value).
A lot of companies I talk to measure their ARR and MRR on a daily, weekly, or monthly basis and save a snapshot in order to monitor their growth over time. These companies are always surprised to hear that this is a problem!
Your ARR will go up when a customer upgrades or converts and will go down when they downgrade or cancel their subscription. By saving snapshots, you will see the deltas and monitor your growth over time, but, you will not be able to cross reference your campaigns and identify your most successful segments.
Track Subscription Updates
The first thing you need to do in order to measure subscriptions and churn is accurately track your customers’ subscription updates.
While it’s important to track every payment made with Woopra, we’re going to focus this blog post on subscription updates. Every time a customer subscription is created, modified, or canceled, you must send an event that you can call subscription update with the following properties:
old acv: The previous ACV value of the subscription.
new acv: The new ACV value of the subscription.
delta: The difference between previous ACV and new ACV.
For example, let’s say a customer upgrades from a $99/month (ACV $1,188) package to a $199/month (ACV $2,388) package. The resulting increase in your ARR (Annual Recurring Revenue) is your ACV delta, which is $1,200 in this example.
[javascript] woopra.track(‘subscription update’, { ‘old acv’: 1188.0, ‘new acv’: 2388.0, ‘delta’: 1200.0 }); [/javascript]
If the customer is creating the subscription for the first time, the old ACV is 0
If the customer is downgrading the subscription, the old ACV is higher than new ACV and the delta is negative
If the customer is canceling their subscription, the new ACV is 0 and the delta is negative
Update Your Schema
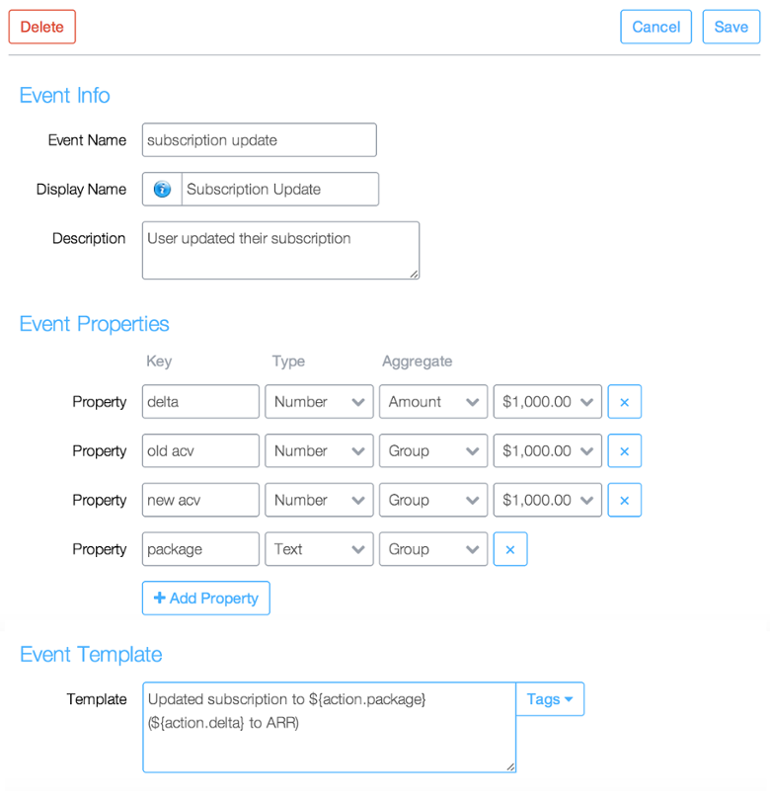
If you’re familiar with Woopra, you know that it’s recommended to update your Schema to help Woopra understand the data types and aggregations that you are sending. This is the second step you will need to take to measure subscriptions and churn with Woopra.
Below is an image detailing how you should set up your Schema for your subscription updateevent.
Monitor ARR Updates Over Time
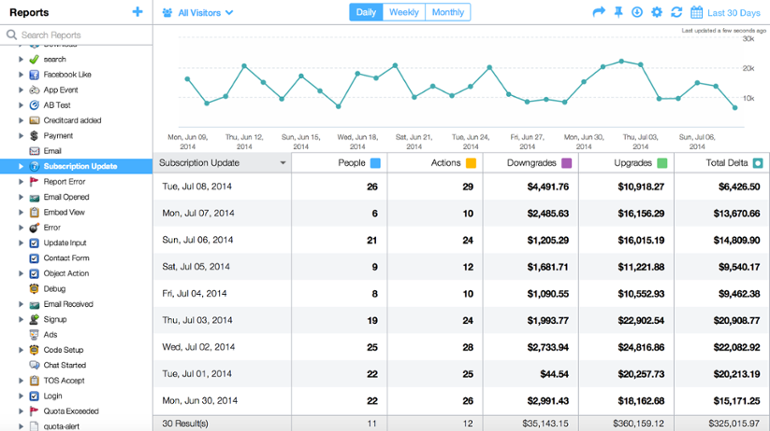
Now that you are tracking the subscription update event and have set up the Schema, Woopra will automatically generate daily, weekly, and monthly reports on your total subscription updates. You can change the date range to see the total increase or decrease over time.
Also Read: Customer Retention Metrics
To access this report, click on the Reports icon in the sidebar (bar chart icon) and click on the section titled Schema Action Reports, then open the report names Subscription Update. Your report should look something like this:
Study Your Sales Cycle & Compare Segment Performance
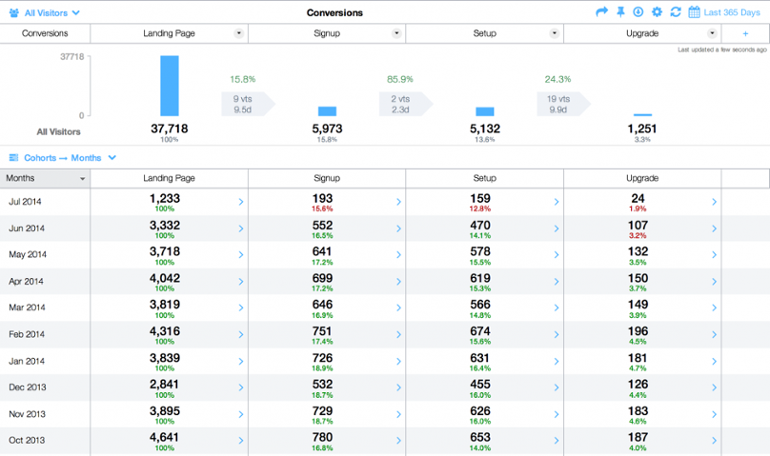
Use Woopra’s Funnel Analytics to study your sales cycle length and identify your highest and lowest performing segments based on all available metrics (such as geolocation, campaigns, lead sources, platforms, etc.).
To create this funnel, click on the Funnels button from the left sidebar in the Woopra web app, and then click on the + button.
From here, you will be prompted to create a new Funnel, which you can do by taking the following steps:
Give your Funnel a name.
Add your first goal. The first goal should represent your customer’s first interaction with your business. To do this, set your first goal as Any Action and add a visit constraint Visit Number = 1. Doing this sets your first goal as the very first action your customer takes when the first time they use your website or app.
Add all the additional goals that customers have to go through before converting (such as signup, trial completion, etc.).
Finally, add the Subscription Update event as a last goal with an action constraint where delta > 0.
For step-by-step instructions on how to set up a Funnel report in Woopra, please see the Funnel Report documentation.
Once you’ve set up this Funnel, Woopra will retro-actively generate a report on your sales cycle, displaying the conversion rate for each of the goals. Woopra will also display the average time & number of sessions between each goal.
Compare Segments & Cohorts
By default, Woopra will compare the performance across daily cohorts. You can change the compare option by clicking on the “Compare” dropdown at the top of the compare section.
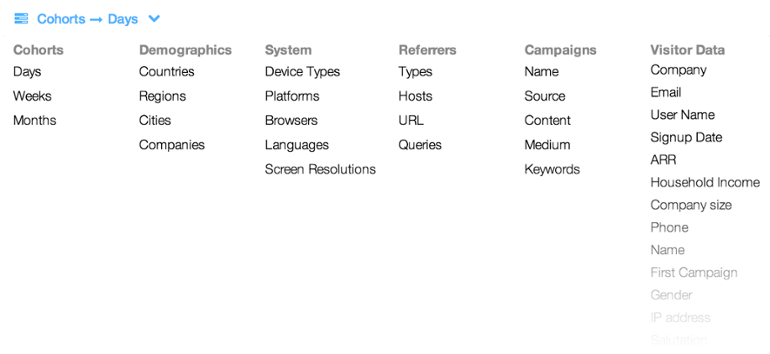
Comparing how well different segments move through your funnel helps you identify your best and worst-performing segments.
Measure Your Customer Retention and Churn
Woopra’s Retention Reports were designed to help you identify how long people continue to do a certain action after they do a specific initial action. For example, Instagram would measure: “How long do people continue to take photos (recurring action) after they signup (starting action)?”.
Now that you’re tracking subscription updates, rather than measuring your retention by running a report on how long people continue to make payments (which is often inaccurate as some payments are usually delayed or retried), you can instead run a report based on at what point people downgrade. The starting event should be the Subscription Update with a positive delta and the recurring event should be the Subscription Update as well, but with a negative delta.
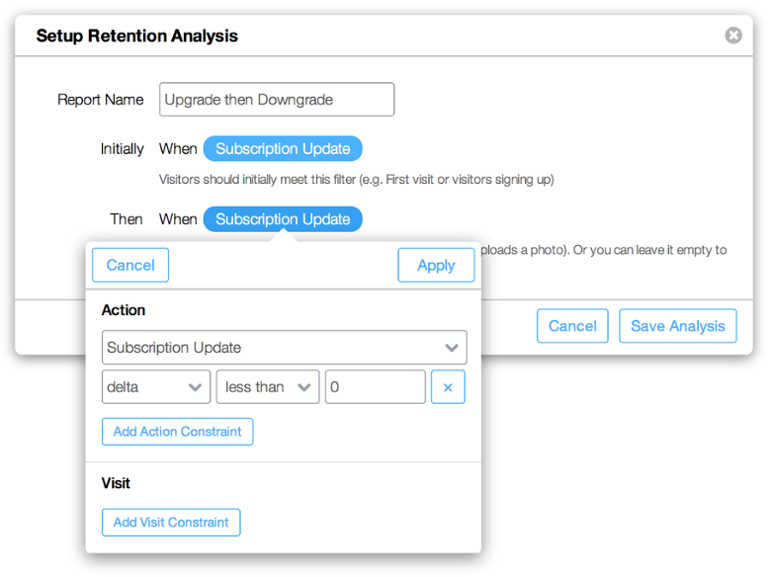
This Retention Report we’ve generated will show you when customers cancel or downgrade their subscriptions. By switching the date unit to “Months”, we can see the changes on a monthly basis, which is ideal for a subscription service that charges per month.
Below, we see that 3.6% of the customers downgrade after one month, 2.6% after 2 months, and so on.
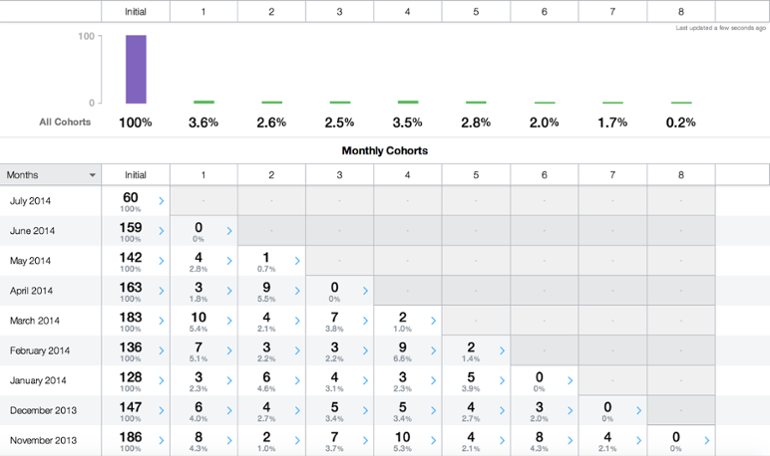
The report above shows us that the longer a customer sticks with your service, the less likely they are to cancel or downgrade their subscription. The conclusion? Early customers need extra attention.
Measuring your yearly churn when you have monthly subscriptions has always been challenging. To solve this problem, export this report to a spreadsheet and measure the opportunity loss. When customers downgrade after one month, you lose 11 months worth of subscriptions from their first year, and 100% on the second, third, and following years.
To measure the churn for the first year, you should multiply the number of churned customers by the number of remaining months of the year. So by doing a little bit of manual work, you can calculate the following formula:

Where: n is month and C is the churn on that month.
In the example above, the first year’s churn is equivalent to:
12% = (3.611 + 2.610 + 2.59 + 3.58 + 2.87 + 1.76 + 0.2*5…) / 12
Bottom line, this approach can be followed with any subscription-based model. You may charge on yearly or quarterly basis, you may have multiple options, you may provide a free trial, or offer a service for free with an upgrade option. Regardless, it’s always very practical to track subscription updates rather than payments which can get cumbersome.
Have questions or feedback? Don’t hesitate to get in touch at support@woopra.com
Learn more about customer journey analytics, product analytics, and customer analytics.


