When it comes to marketing analytics, an under-appreciated piece of advice for small businesses is: keep it simple. That can be difficult to do in the era of big data, with buzzwords like factor analysis and predictive analytics on the tip of everyone’s tongue.
So, with that in mind, let’s take a look at seven key marketing analytics techniques, how each technique can support and inform your marketing activity, and how you can take some of these digital analytics ideas to the next level.
1. Set up Conversion Goals for Important Events
Most digital marketing teams are measuring conversions at least in the sense that they’re measuring a marketing metric such as sales or subscriptions — the point where a visitor becomes a customer. That’s great, but it’s really only the tip of the iceberg when performing marketing analysis.
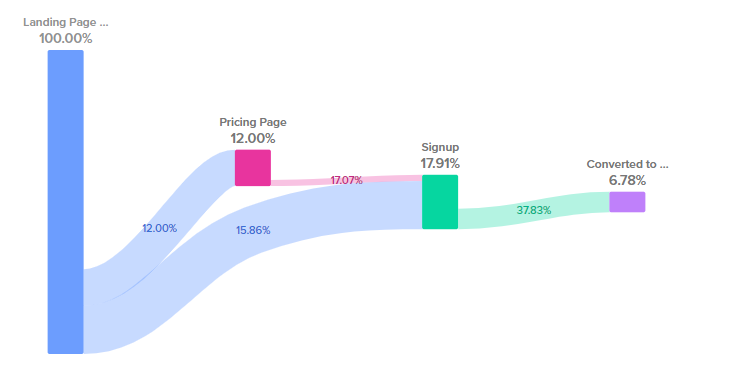
While the length of a customer journey varies by industry, company, and product, if there’s one big takeaway from customer journey analytics, it’s that customer journeys are often longer and more complex than we expect!
So, while the point of sale is one important conversion point for marketers to measure, it’s far from the only one. When you map out customer journeys, you’ll probably begin to notice these other conversion events. For example, opening a marketing email is a conversion of sorts and plays a key role in customer acquisition later on down the road.
Whatever your key conversion events are, you should be tracking them and measuring them against concrete goals based on your company’s past performance and industry standards. This will allow you to identify the most impactful areas for improvement in your marketing effort.
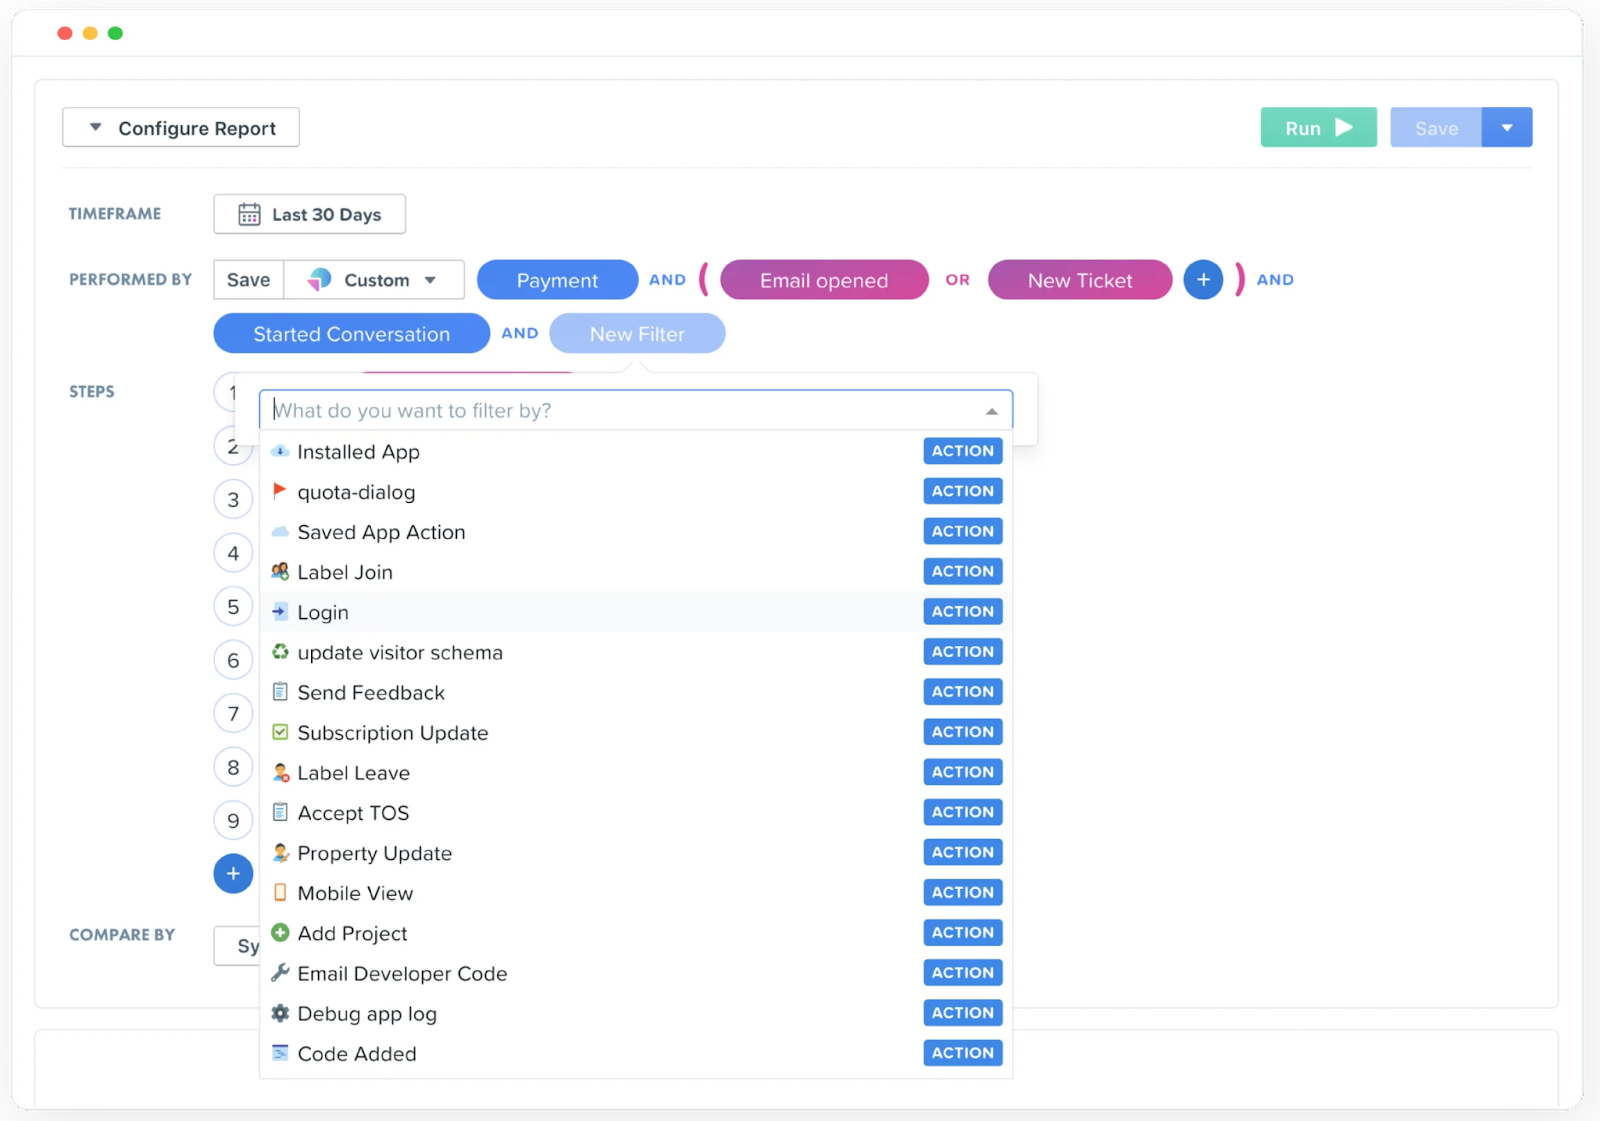
For example, you might find from your marketing insights that users are opening your emails at a rate of 22%. This is an excellent rate if you’re in the beauty industry, where open rates average below 17%. But if you’re a non-profit (average 25% open rate), you know your subject lines probably need work.
Don’t forget that with the best web analytics tools, like Woopra, you can define custom conversion events based on customer behavior analysis. For example, if users viewing a video is important, your marketing team could measure views of that video as a conversion metric.
Additionally, keep in mind that you should be forecasting where you expect your conversion goals to be and then doing data analysis comparing real-world performance against your forecasts.
2. Integrate Data from All Your Marketing Platforms
This might be the single most important thing you can do to improve your marketing performance. And yet, many marketers don’t do it! Why?
Simply put, it’s not easy, and this is one of the more advanced marketing analytics techniques. Your marketing initiatives are probably spread across a variety of marketing channels, such as email marketing and content marketing, each with its own tracking and analytics tools. Getting all of that data into the same place and integrating it is a tremendous data engineering challenge for marketers.
Fortunately, there are now data analytics tools like Woopra that handle this integration for you, linking easily with popular marketing tools and bringing all of the data together for advanced marketing analytics.
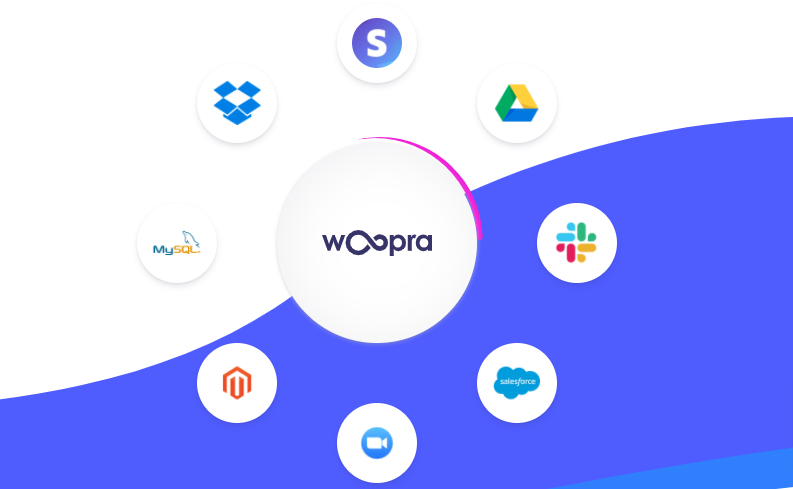
Regardless of how you accomplish it, getting a holistic view of all of your marketing data, from web analytics metrics to product usage data makes it easier to do effective forecasting based on market trends, marketing decisions, and most importantly, consumer behavior. All of which are critical elements in marketing mix modeling.
It’s easy for marketers to get tunnel vision on the marketing channel or channels they’re primarily responsible for. If you’re the social media guy, you’re probably tracking a whole bunch of social media analytics. But remember: that’s not how customers actually interact with your brand!
No customer looks at 15 different Twitter posts, clicks on their favorite, and then buys your product. Often, conversion happens after a long journey, with marketing touchpoints across a dozen different channels.
With that being the case, there’s simply no way for marketers to understand what’s really going on without integrating marketing data.
Even with a predictive analytics tool like Woopra, it will take a little up-front investment of time to get each platform linked, but the effort is absolutely worth it. Especially given that due to that same “up-front time investment” factor, it’s something your competitors might not be doing!
3. Track Users by Funnel
Funnel tracking should play an important role in any kind of digital marketing analytics strategy. Funnels provide a clear way to visualize important parts of the customer journey and tracking the drop-off between funnel stages lets you know which areas of your marketing need work.
For example, are you getting tons of newsletter signups, and lots of email opens, but very few clicks and sales? You need to improve the quality of your newsletter content, and that would be evident very quickly if you saw that data represented in a funnel chart.
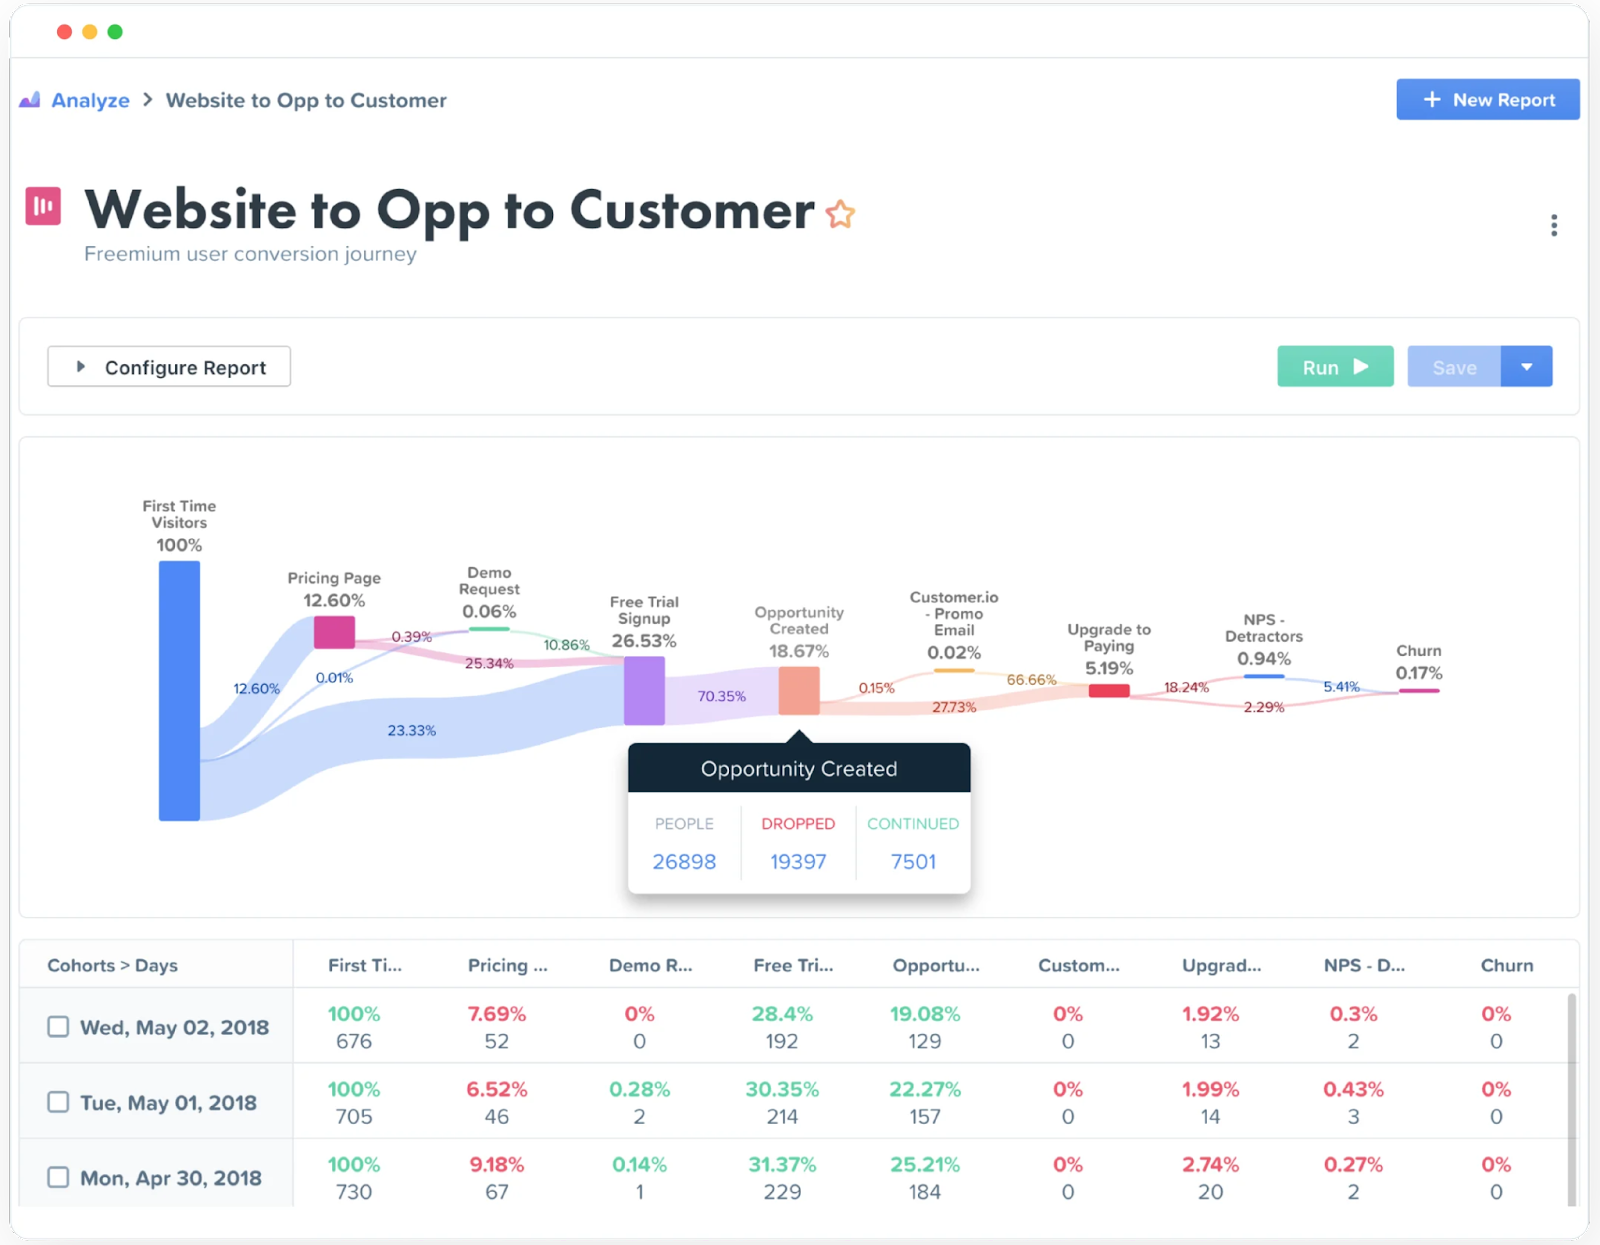
Most marketers are already aware of the benefits of funnel analysis, but it’s worth mentioning that you should also keep an eye on user segments and how they move through your funnels differently.
Visualizing a marketing funnel and then filtering with customer segmentation can be a great way to quickly identify areas for improvement or increased personalization.
Don’t assume that the “overall” marketing funnel chart for your business also represents how smaller user segments move through the funnel.
4. Use UTM Parameters
Tracking the effectiveness of a marketing campaign — a digital advertising campaign, for example — is much easier if you make use of UTMs.
UTMs are customizable tracking parameters you add to the end of links. Typically, these parameters give some information about where the user is coming from and what campaign they were seeing in the Google Ads they clicked on.
Here’s an example of what a URL with UTM parameters looks like:

The UTM parameters in the link above tell you that the user saw an email you created and sent with Marketo as part of your December product development promo campaign.
When someone clicks one of those links, marketing analytics software like Google Analytics registers the UTMs so that you’ve captured all of that information.
This makes it easier to analyze the effectiveness of marketing campaigns. For example, if average site visitors convert at 3% but visitors who came via links with that UTM convert at 6%, you know something about that campaign is working!
Optimize for Conversion & ROAS Now! Explore Woopra in a demo and enjoy a 2-week free trial: https://www.woopra.com/demo
5. Create Remarketing Audiences
Particularly if you use a session-based tool such as Google Analytics, it’s easy to fall into the trap of viewing visitors through a single-session lens and forgetting about the ones that visit your site but don’t convert.
But that’s a mistake in marketing management! As mentioned earlier, customer journeys can be long, and people often visit a site many times before becoming a paying customer. Marketers should be actively looking to remarket to people who visited the site but didn’t convert.
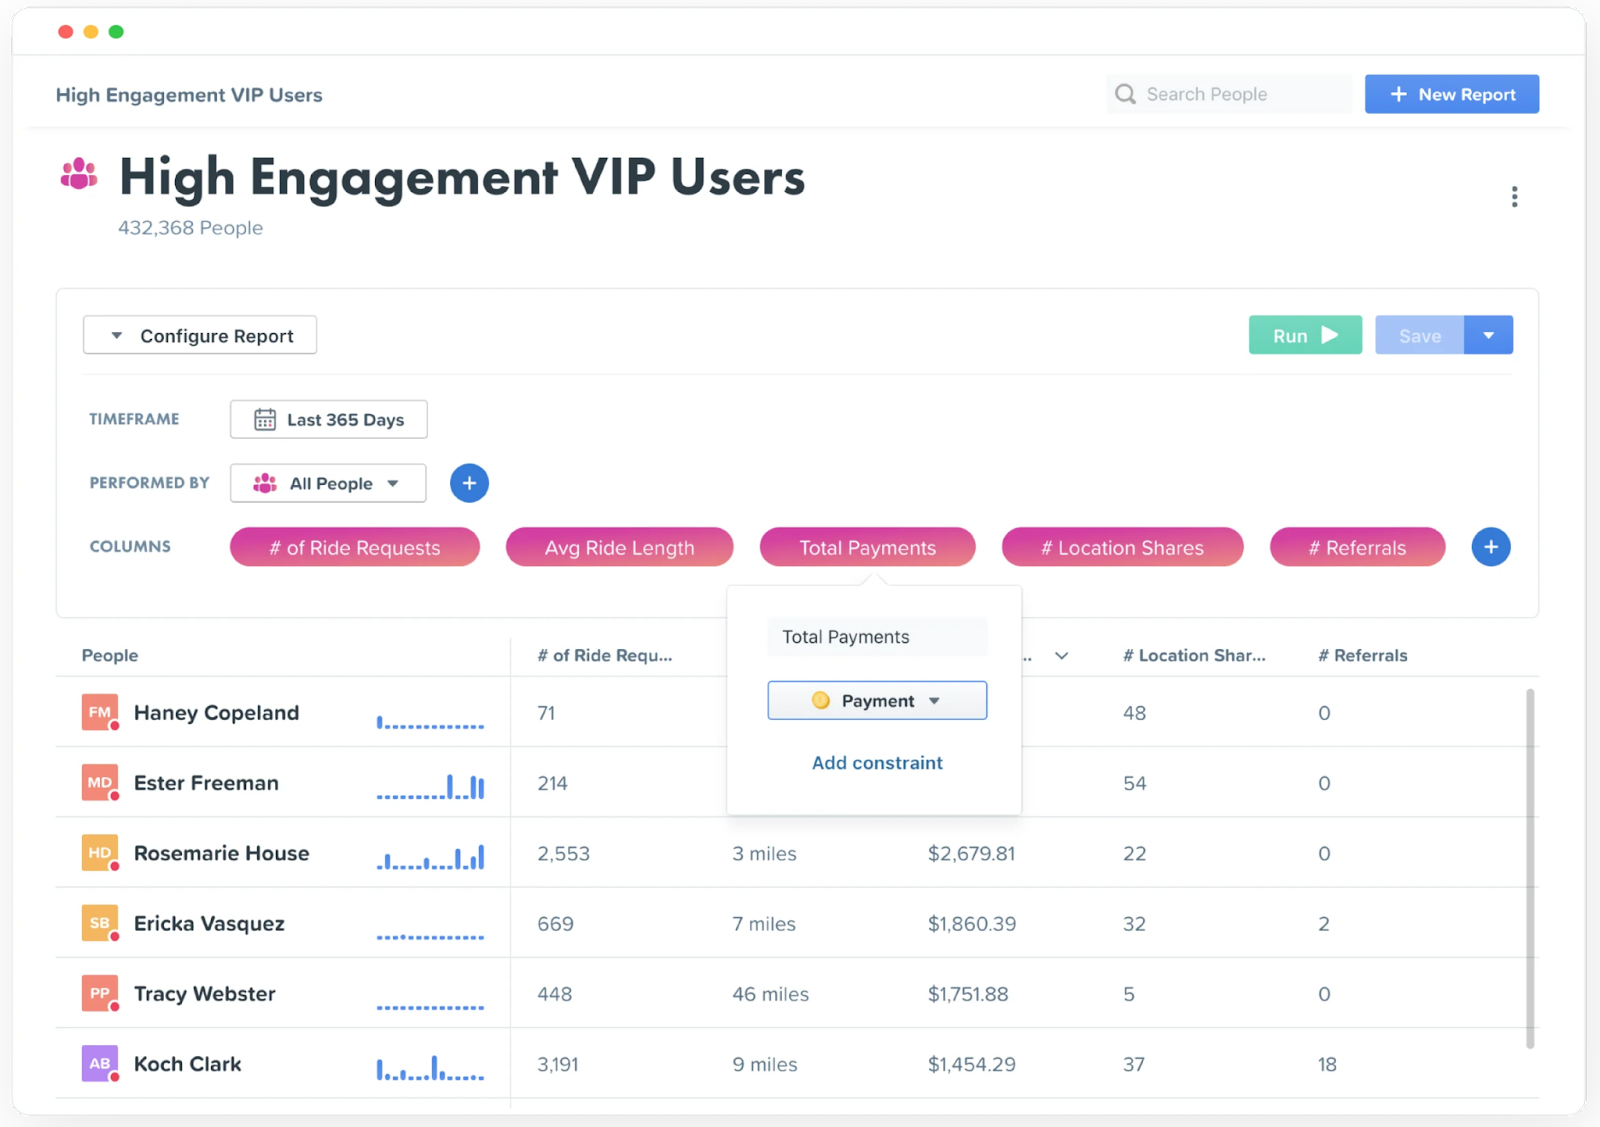
Remarketing effectively means segmenting and building audiences, which, in turn, means that you’ll be doing some data analysis. A good prescriptive analytics tool with event-based tracking should make it pretty easy to create remarketing segments based on customer behavior.
And of course, this technique is most effective when combined with some of the others we’ve talked about. Knowing your key conversion points and how different user segments tend to move through the funnel can help you create and target remarketing audiences effectively.
For example, if the various conversion metrics you’re measuring indicate that getting people to watch a video is key once they understand your brand, then remarketing to repeat website visitors with that video is probably a good idea.
Combining multiple analytic techniques in this way is a great way to figure out how you can make your marketing efforts even more efficient. You can also make use of advanced techniques like cluster analysis to identify unique audience groups.
6. See Which Pages Have the Most User Scroll-Depth
In the world of web analytics, it’s easy to get hung up on high-level marketing metrics like pageviews and bounce rates. But don’t forget about depth-related metrics. How long are users spending on your pages? How far are they scrolling?
Digging into scroll depth data can provide lots of actionable insights for content marketers and designers in particular.
For example, if you notice a pronounced drop-off point halfway through a long article, that might suggest that the content could use some trimming. Or perhaps that section just needs a bit of excitement added to keep readers engaged.
Similarly, if there’s an obvious drop-off point midway through a landing page, that could suggest something about the copy or design on that section of the page is not working.
Don’t forget that lots of scrolling and time on the page isn’t always a good thing. If users are spending ten minutes on a product page, scrolling all the way to the bottom, and then not converting, it might mean they’re not finding the information they’re looking for.
(This is an area where quantitative data work can be bolstered by qualitative surveys. If you notice usage patterns on a page that you can’t easily diagnose from the descriptive analytics data, the best thing to do is often to survey visitors on that page and ask them what they’re looking for).
7. Analyze Your Traffic by Marketing Channel
“Half the money I spend on advertising is wasted,” businessman John Wanamaker famously said, “the trouble is I don't know which half.” It’s a quote that still resonates in marketing circles, but the truth is, there’s no excuse for that kind of ignorance today in market research.
Unlike Wanamaker, modern marketers have access to advanced analytics and in-depth tracking across virtually every channel to understand customer behavior start-to-finish. With Bluetooth beacons and other similar tech, even offline marketing channels are easier to track than they were in Wanamaker’s day!
Analyzing the marketing performance of each channel should be a major part of any modern team’s marketing data analysis strategy. This should include an analysis of channels’ past performance, but also future market analysis and forecasting with predictive analytics where the data allows.
This should include keeping an eye on the broader landscape of digital marketing because the effectiveness of a channel can change pretty quickly. If your users are moving to a different social media channel, for example, you may want to move too, even if the ROI isn’t there yet.
In this article, we’ve laid out seven essential marketing analytics techniques, but this is really just the tip of the iceberg. Once you’ve got these basics covered, there’s even more power to be unlocked by digging into more advanced analytics to inform your marketing strategy.
For marketers interested in data science and machine learning, regression analysis is a good place to start, but the sky is really the limit. Just don’t forget that your data is only as valuable as it is accessible and understandable.
That’s why having a marketing analytics platform like Woopra, which puts all of your data in one place, with easy visualization and report-building tools, can make a massive difference in the value you’re getting from your data. You can leverage it to fully understand the customer experience and the nuances of your marketing performance without having to be a data analyst.
Check out the other articles in our Marketing Analytics series:
- The 3 Types of Marketing Analytics
- The Best Marketing Analytics Tools
- The Essential B2B Marketing Analytics Guide
- Marketing Analytics: What it is, Why it’s Important, and How to Use Analytics Software


