Marketing attribution is an absolute must for identifying which touchpoints in the customer journey most heavily impact conversions.
And with the modern customer journey being more complex than ever, seldom is there a single touchpoint involved.
That’s where multi-touch attribution modeling comes in.
What is Multi-Touch Attribution Modeling?
A multi-touch attribution model looks at every touchpoint in the customer journey leading up to a conversion event and assigns each touchpoint a fractional credit.
Rather than merely giving credit to a single touchpoint, multi-touch attribution analyzes all touchpoints collectively and gives each touchpoint a value.
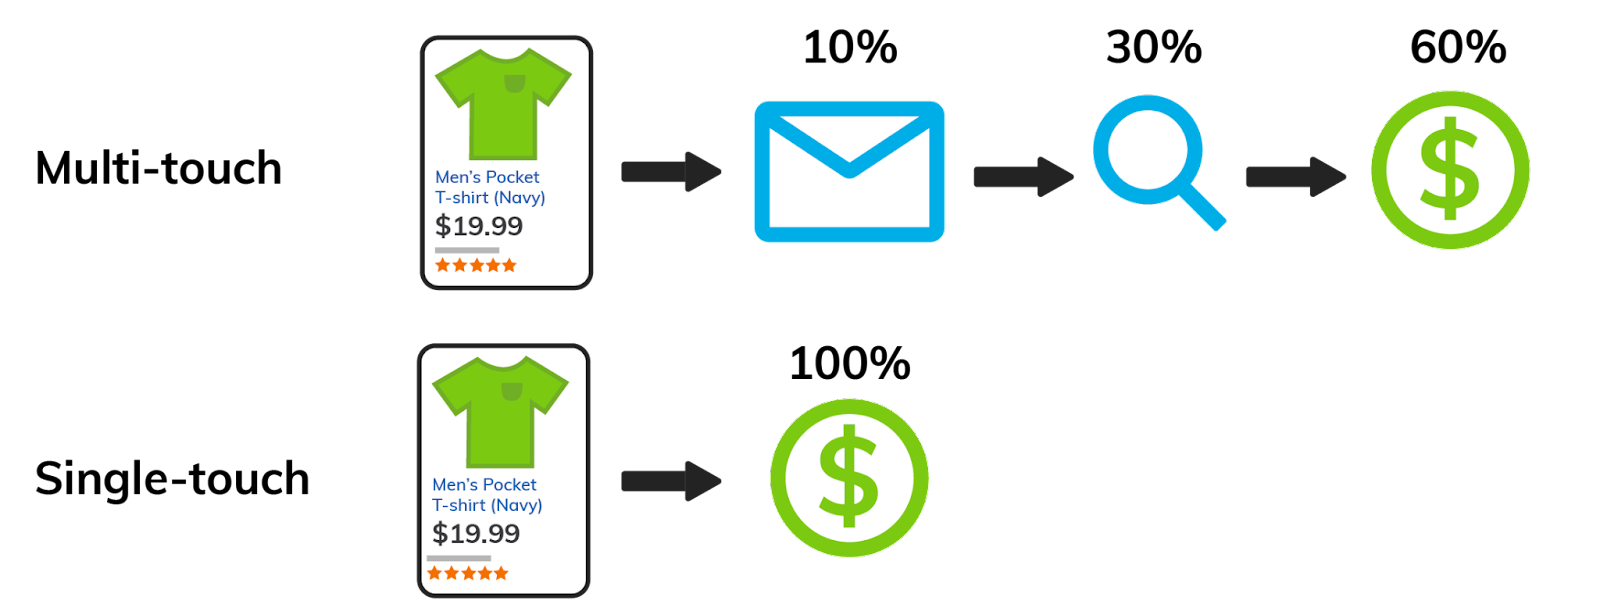
Say, for example, a t-shirt company wants to see what sequence of steps in the buyer journey leads up to a sale.
If they used a single touch attribution model, they may only look at the initial ad the lead saw and nothing else.
If, however, they used multi-channel attribution, they would look at multiple touchpoints. Such as the initial ad the lead saw, the email they sent the lead, and the product search the lead performed on their website.
All the while, the company would assign a certain amount of credit to each touch point.
 Source: Oktopost
In turn, they would have a much more holistic understanding of the customer journey.
They could see the buyer’s journey from end to end and determine how big of an impact each touchpoint had on the ultimate conversion.
And having this data can be highly beneficial, as it can help marketers enhance the buyer journey, minimize friction points, improve engagement, increase conversions, and boost ROI.
First-Touch vs. Last-Touch
Two other popular types of attribution modeling are first-touch attribution and last-touch attribution.
With the first touch, a conversion credit is given to the very first touchpoint in the customer journey, regardless of how many touchpoints there are.
If, for instance, the first touchpoint for a Woopra customer was this blog post, it would receive full credit for the conversion event.
With the last touch, the final touchpoint in the buyer journey receives credit for a conversion, again regardless of how many touchpoints there were.
Say, for example, the last thing a lead did before purchasing a Woopra plan was download The Ultimate Guide to Analyzing the Customer Journey. That would be a touchpoint that receives credit.
While first-touch and last-touch attribution models can certainly be helpful, they don’t always tell the whole story.
After all, there are often many touchpoints between the first and last touch in the customer journey.
For that reason, many marketing experts consider them somewhat outdated and not usually as effective as multi-touch attribution modeling.
And with several different multi-touch attribution models, you can choose the perfect approach to fully understand the complete buyer journey.
This brings us to the next section.
Other Attribution Model Types
Linear Attribution
This model looks at all touchpoints in the buyer journey and gives equal credit to each.
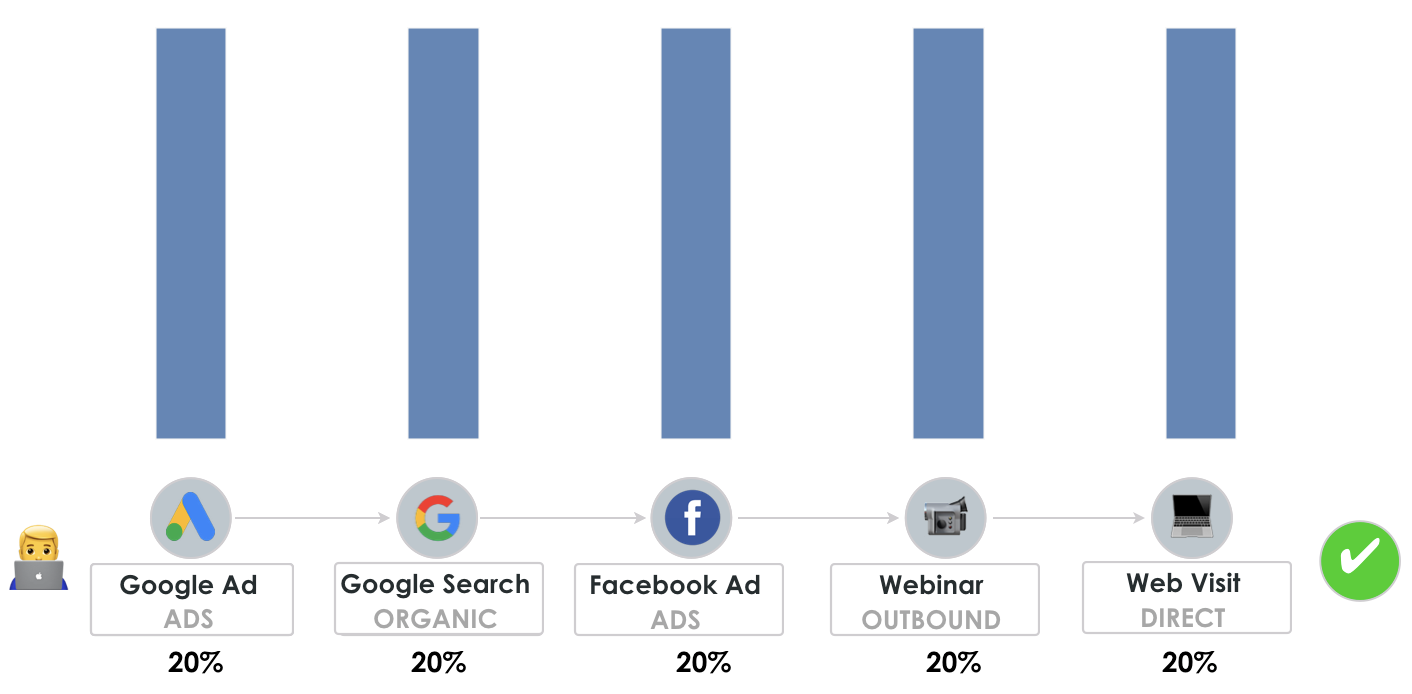
Say that a lead first discovered a company through a Google Ad, then searched for them on Google, then saw a Facebook Ad, then attended a webinar, and finally visited their website before buying for a total of five touchpoints.
Each of those five touchpoints would receive an equal 20% of the credit.
 Source: PixelMe
While linear attribution isn’t quite as detailed as some other forms of attribution modeling, it still provides a nice baseline.
Therefore, it can work well if you just need a basic overview of the customer journey.
However, because each touchpoint can have a different level of impact on a conversion event, linear attribution isn’t ideal for marketers that want more granular insights.
Time Decay Attribution
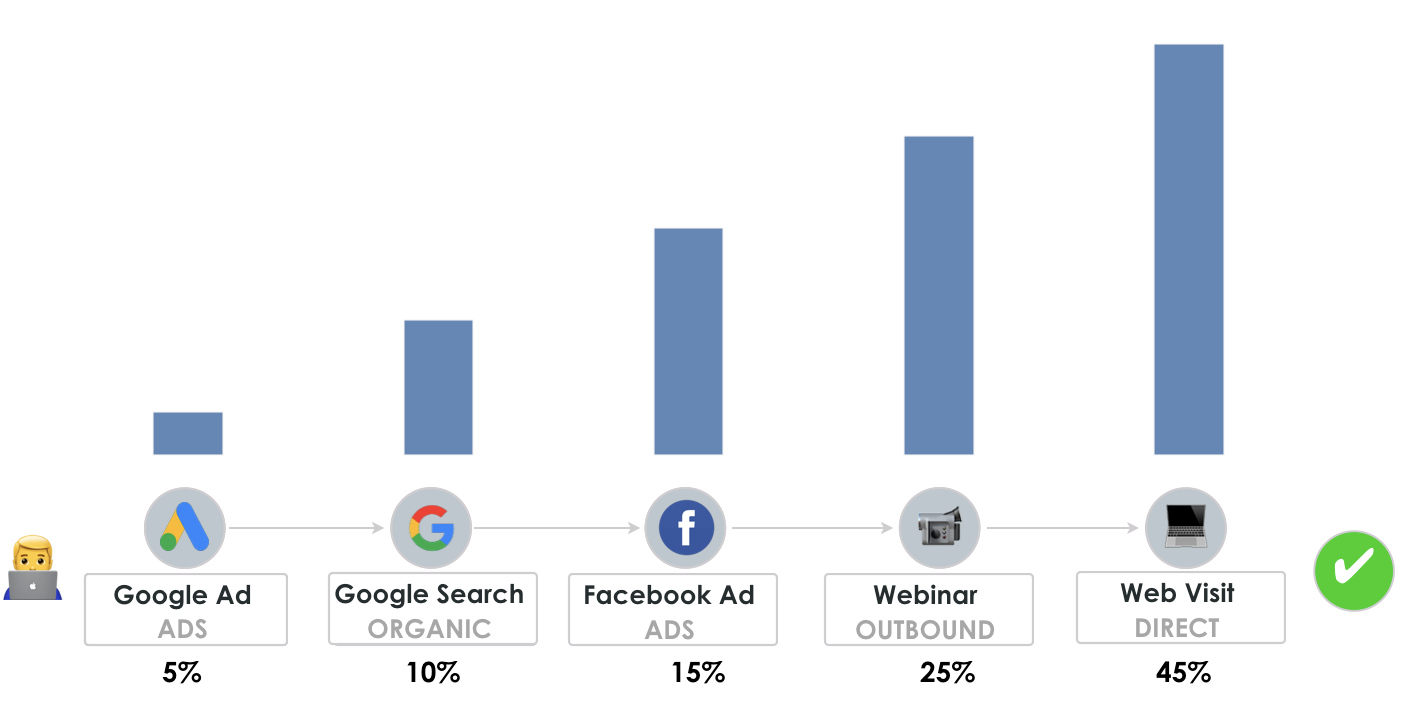
With this model, the closer a marketing touchpoint is to a conversion, the more credit it’s given.
For instance, the amount of credit given to the initial touchpoint of viewing a Google Ad may only receive 5% of the credit, while the final touchpoint of visiting a website may receive the most credit at 45%.
 Source: PixelMe
Time decay attribution assumes that earlier touchpoints are less influential in a conversion than later touchpoints.
It can work well when there are several touchpoints involved and acknowledges that not all touchpoints are equal.
That said, by default, it assigns more value to later touchpoints, which means you may not always properly optimize for the earlier touchpoints.
W-Shape
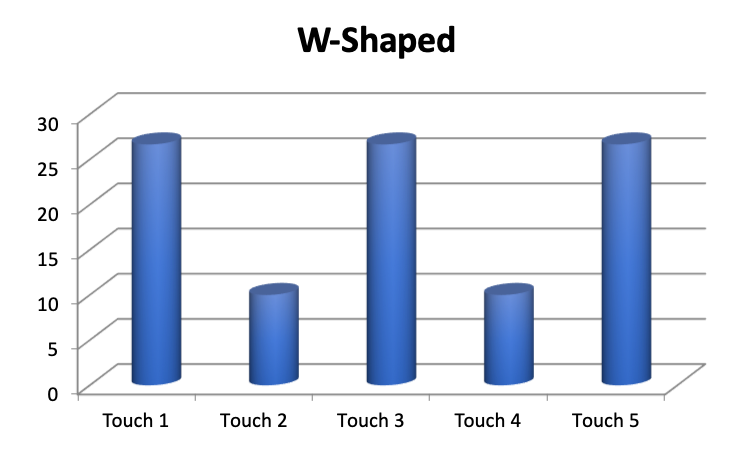
W-shaped attribution gives the most credit to the first, middle, and last touchpoints of a buyer journey.
When you look at this attribution model on a graph, it has a W-shape — hence the name.
 Source: Skip Fidura
Going back to our example of a buyer journey that goes from a Google Ad to a Google search to a Facebook Ad to a webinar to a website visit, a W-shape attribution model might assign:
- 30% of the credit to the Google Ad
- 5% to Google search
- 30% to a Facebook Ad
- 5% to a webinar
- 30% to a website visit
 Source: PixelMe
The main benefit of this model is that it gives even credit throughout different touchpoints.
However, it may be overkill if you have a simple, straightforward sales cycle.
U-Shape
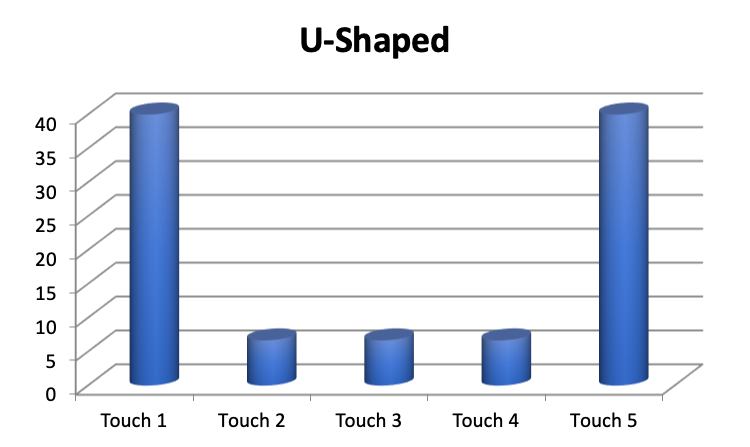
U-shaped attribution gives the most credit to the first and last touchpoints and assigns a smaller, evenly distributed amount to the touchpoints in the middle.
So on a graph, it looks like the letter U.
 Source: Skip Fidura
Let’s go back to our example one last time.
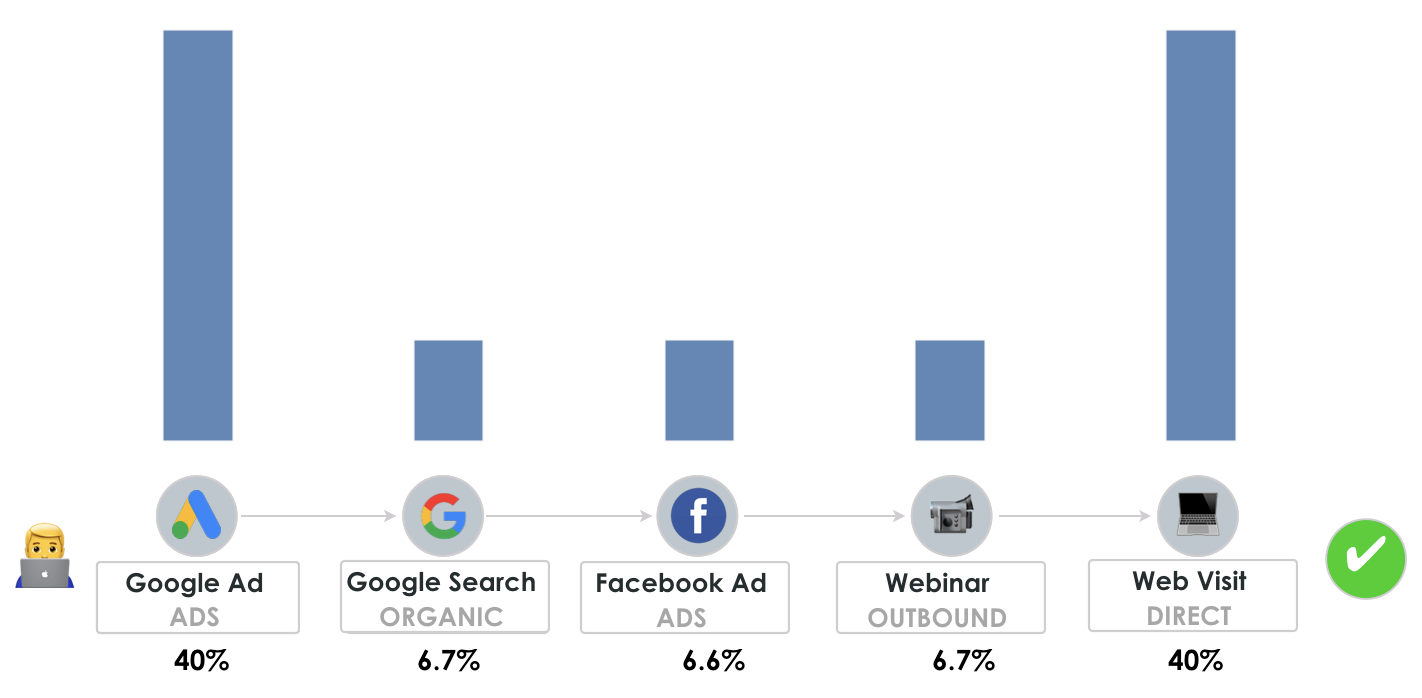
With a U-shape attribution model, the initial Google Ad a lead saw, and the final web visit may each receive 40% of the credit for 80% total.
And the other touchpoints that collectively account for the remaining 20% would be equally divided to receive about 6.7% each.
 Source: PixelMe
The core advantage of this marketing attribution model is that it gives value to the first and last touch points so you can optimize your customer journey to bring in new leads and increase conversions.
The main downside is that it may prevent you from optimizing the remaining middle touchpoints, which could potentially throw off your overall marketing effort.
Custom Multi-Touch Attribution Model
Or, if none of the models we’ve mentioned don’t quite have what you’re looking for with your mix modeling, you can always use custom attribution.
With this, you choose how much credit to give each touchpoint in the customer journey.
 Source: PixelMe
For example, you may assign more credit to a webinar than someone viewing a Google Ad or finding you through a social media marketing channel.
When done correctly, a custom multi-touch attribution model can be extremely effective and should, in theory, produce the highest conversion rate and ROI.
Just note that it can be tricky to set up and may be unnecessary if you have a short, simple customer journey.
How to Implement Multi-Touch Attribution
The first step is to select the multi-touch model you want to use for your marketing campaign.
If, for example, you have a simple sales cycle and only need a basic overview of the customer journey, a linear model may be a good option.
Or, if you wanted to give credit to the first, middle, and last touchpoints, W-shaped attribution would probably be right for you.
Next, determine your KPIs.
Some top-of-the-funnel KPI examples include:
- Clicks on social media ads
- Clicks on Google Ads
- Organic search traffic
Some middle-of-the-funnel KPI examples could be:
- Blog post page views
- eBook downloads
- Webinar views
Some bottom-of-the-funnel KPI examples include:
- Product page views
- Product demos scheduled
- Sales rep consultation requests
From there, you’ll need to deploy the analytics software you want to use to generate data.
For instance, Woopra is a popular option for marketers that want to implement multi-touch attribution to thoroughly understand how each touchpoint fits into the buyer journey.
Woopra is designed to maximize growth, increase customer retention, and create an overall better customer experience.
Of course, Google Analytics is always another option for generating basic data and is a universally used platform by countless companies.
Note that there are usually default multi-touch attribution settings in each analytics platform. But most can be adjusted to match the specific model you want to use.
At that point, it’s simply a matter of generating data and applying your findings to optimize key touch points throughout the buyer journey.
Challenges with Multi-Touch Attribution Modeling
Lack of Offline Metrics
This type of marketing mix modeling is primarily used for digital marketing.
Tracking digital KPIs like Google Ad clicks, eBook downloads, and product pages viewed is pretty straightforward with these attribution models.
However, tracking offline metrics like direct mail, print ads, and word-of-mouth referrals through customer stories is much more difficult.
And this can create a problem given these offline metrics are often integral touchpoints to some campaigns and something to note if much of your marketing is done offline.
Data Quality and Consistency
Not all marketing analytics platforms are created equal, with some like Google Analytics having limitations that can compromise data quality and consistency.
“Google Analytics only lets you compare data from 90 days prior to conversion, making it obsolete for longer sales cycles, ongoing comparisons, and historical comparisons,” explains Mark Sullivan, Director of Demand Generation at CallRail.
He also points out that, “Google Analytics’ terms and conditions prohibit the use of personally identifiable information in your conversion events.”
This too is something to keep in mind when choosing an analytics provider.
Selecting the Right Attribution Model
We listed seven different attribution model types above.
And it’s fair to say this can create a bit of “choice paralysis” for many marketers, which is another common challenge.
By understanding the pros and cons of each model, however, you should be able to narrow it down to one or two models that best match your needs.
With some trial and error, you should find the perfect fit in time.
Data Wrangling
There’s also the issue of transforming raw data into digestible, useful insights that can be applied to optimize your marketing strategy.
If there’s a large volume of data and you’re using a complex model, this process can be difficult.
That’s why you’ll want a visual-centric analytics platform that makes the data-wrangling process simple and intuitive.
Addressing the Impact of Seasonality and External Factors
While it’s true that an MTA model can tell marketers a lot, it still has its limitations if aggregate information isn’t incorporated.
For instance, a seasonal trend or external factors could temporarily impact conversions but may not apply year-round.
That’s why a unified analytics approach is important, as it helps marketers see the big picture.
Best Practices to Follow for Multi-Touch Attribution Modeling
Defining Business Goals and KPIs
A critical precursor for success with any type of analytics is clearly articulating your business goals and the KPIs you need to measure in order to achieve them.
And attribution models are certainly no exception.
Before anything else, you’ll need to identify business goals and KPIs and make adjustments over time to ensure you continually hit the mark.
Evaluating and Testing Multiple Models
Again, with several attribution models available, it’s important to have a clear understanding of how each one works and which ones are most compatible with your business goals.
We provided a basic overview of the attribution models above, which should serve as a good starting point.
But we recommend doing further research and evaluation on the attribution models that sound the most fitting for your needs.
Then, test those attribution models to see which works best.
Collaborating Between Marketing and Data Teams
One of the biggest hindrances to data science as a whole is data siloing where critical information is “siloed” where it’s under the control of one team while another team doesn’t have access.
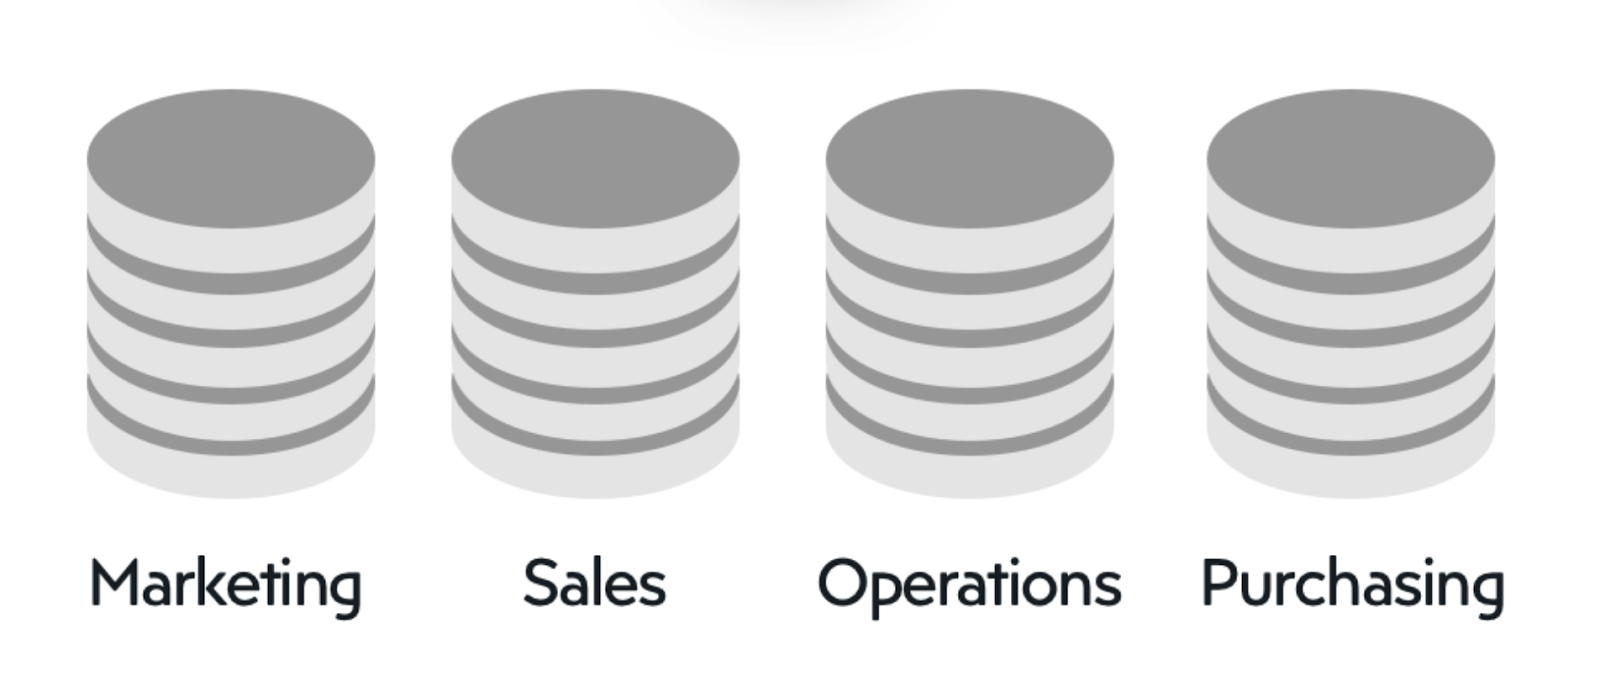 Source: Factory
This can hurt progress because it often leads to a communication/collaboration breakdown.
That’s why you’ll want to emphasize streamlining collaboration between your marketing and data teams so that information flows freely and you can better optimize the buyer journey.
Incorporating Customer Data and Insights
Regardless of the specific attribution models you use, you’ll want to find practical ways to incorporate the data you generate to optimize the buyer journey and create the best experience possible.
For example, with content marketing attribution, you may want to use your insights to write more blog posts on topics your readers enjoy and are resulting in the most conversions.
Or, if the data clearly shows that webinars are having a big impact, you would want to double down on them.
Leveraging Technology and Automation
There are three main types of marketing analytics — descriptive analytics, predictive analytics, and prescriptive analytics.
All three offer cutting-edge technology, and most offer some form of automation that can save time while helping you get the most out of MTA modeling.
The key is to look for a platform with robust technology and specific automation capabilities that will best serve your marketing team and accomplish more with less effort.
Conclusion
If you want a holistic understanding of the buyer journey and to connect the dots of how each touchpoint culminates in a conversion, multi-touch attribution is for you.
It’s just a matter of understanding the different attribution models, the inherent challenges, and following best practices to improve all of the touchpoints of the buyer journey.
By doing so, your customer wins because of the amazing experience they get from start to finish.
And your business wins because you can build a more fluid sales cycle while maximizing conversions and ROI.


