User experience can make or break your product.
If the UX is smooth and seamless, users will engage longer, use your product more frequently, and have an overall positive experience.
If the UX is friction-filled, the opposite is true, and the customer experience will suffer.
One of the first steps to optimizing your product’s UX is implementing user experience analytics.
What Is User Experience Analytics?
UX analytics involves gathering, analyzing, and interpreting user experience data and then acting on it to improve the UX design and overall user experience.
Whether it’s a website, app, SaaS tool, or any other type of digital product, the process is the same.
UX analytics focuses on understanding how users engage with your product to identify pain points and product strengths to gain objective insight into what’s working and what’s not.
Then, as you accumulate data, you can make the right adjustments to better satisfy user needs and create a more satisfying customer experience.
If, for example, a particular feature was unintuitive and creating frustration for a high volume of users, you could pinpoint it. From there, you could explore potential changes until you resolve the issue.
The underlying purpose of CX analytics tools is to provide your team with data-driven insight into how your customers experience your product so that you can make continual improvements in the digital experience.
In turn, this can lead to a variety of benefits, including:
- Streamlined UX research
- Better UX design
- Customers using your product longer and more frequently
- Less customer churn
- Increased conversions
- Deeper brand loyalty
But it all starts with first gathering critical user experience data, which requires the right UX analytics.
Quantitative Methods of UX Analysis
Quantitative data refers to using UX analytics tools to gather numbers-based information to objectively measure user experience.
Website Analytics
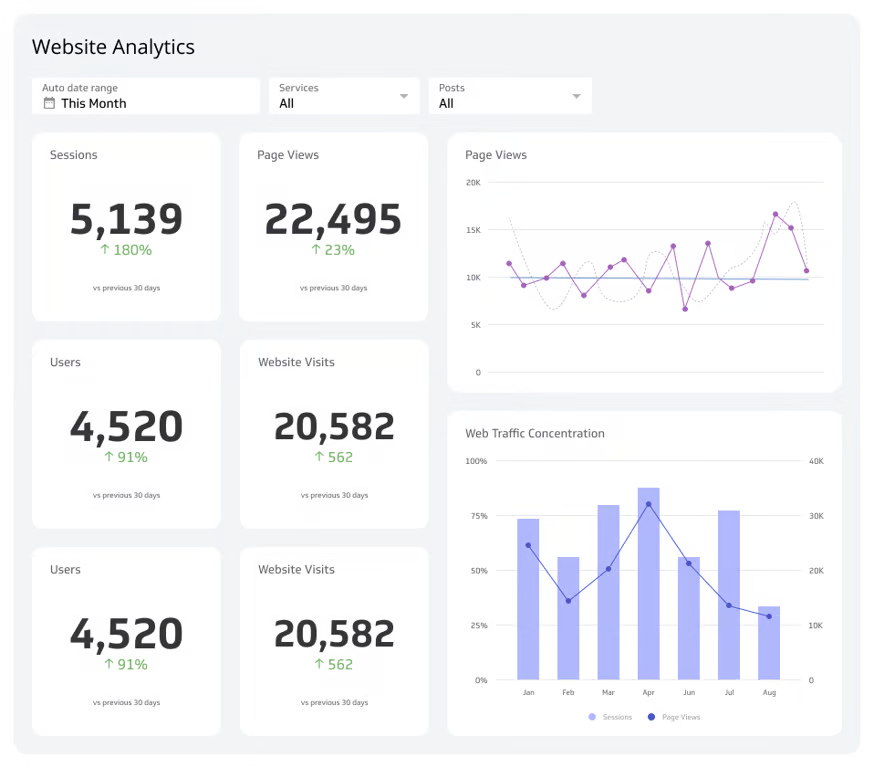
Web analytics is one of the broadest areas of UX analytics and includes metrics like:
- Website visits
- Number of users
- Page views
- Average user session duration
- Bounce rate
- Click-through-rate
- Conversion rate
- Event tracking
Source: Klipfolio
The main purpose of a web analytics tool is to figure out how many people visit your site, how long they stay there, the paths they take while on your site, how they’re engaging, the content they’re looking at, and where they exit.
When it comes to performing basic user research, these UX tools are a great starting point.
Product Analytics
Product analytics specifically focuses on gaining insight into product usage and performance.
With it, you can gain an end-to-end perspective on how customers engage with your product and have a UX designer optimize it accordingly.
If, for instance, you launched a new core product feature, you could use this type of UX analytics to determine how many users returned.

Source: Woopra
While there will likely be some level of drop-off over time, a steep drop-off would indicate there’s an issue that needs to be addressed.
If you’re looking to assess product performance and better understand its strengths and weaknesses, product analytics is a must.
Heatmaps
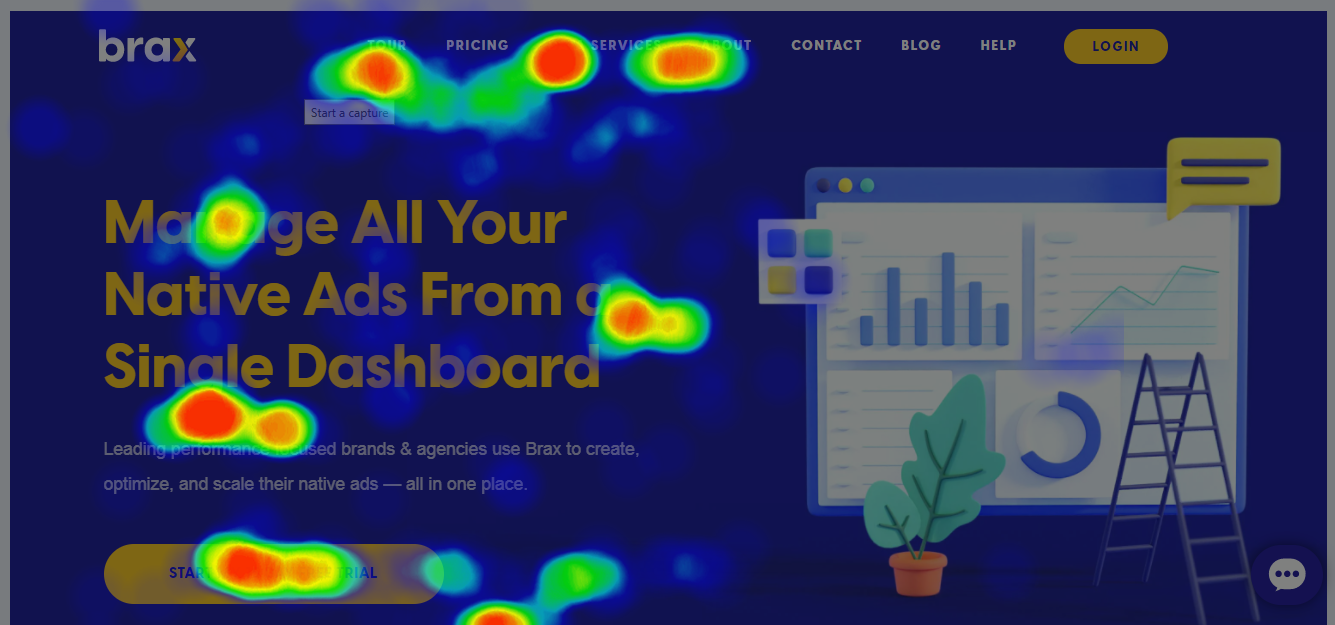
This is one of the more visual-centric quantitative data tools and shows you firsthand how users are interacting with your product.
Take this heatmap, for example, it shows the areas of a homepage that receive the most attention.
Source: Brax.io
With it, you can clearly see that the “Tour,” “Services,” and “About” sections receive the most attention on the menu.
Also, the main headline and “Start your free trial” CTA receive plenty of attention as well.
In turn, this type of behavioral analytics tool helps you figure out what users are clicking on, as well as what they’re ignoring.
A/B Testing
A/B testing is a simple yet impactful way of generating quantitative data to compare two UX elements side-by-side to determine which gets the best results.
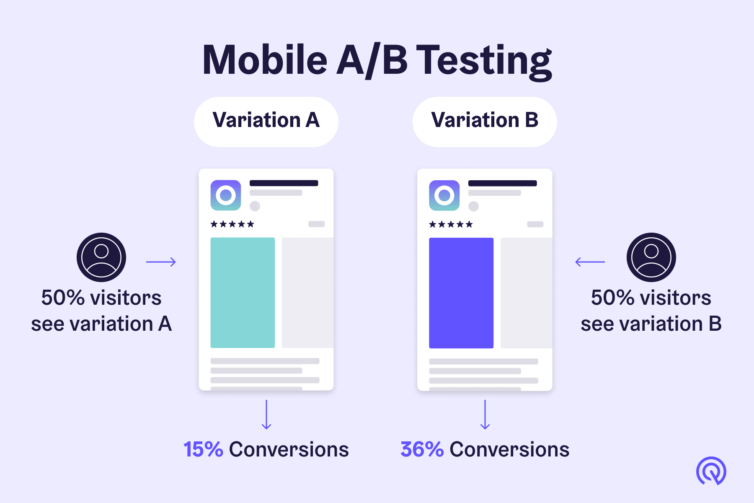
Say, for instance, you wanted to compare two different versions of your app store listing to see which resulted in more conversions.
With AB testing, you could show Variation A to half of the users and Variation B to the other half.
If Variation A resulted in a 15% conversion rate and Variation B resulted in a 36% conversion rate, Variation B would be the clear winner.
Source: App Radar
This is just a simple example, and A/B testing has countless applications, including web/app product optimization, product development, marketing, e-commerce, and content creation to name a few.
On-site Surveys
Or, you can always go straight to the horse’s mouth with on-site surveys and directly ask users about their experience and overall customer satisfaction.
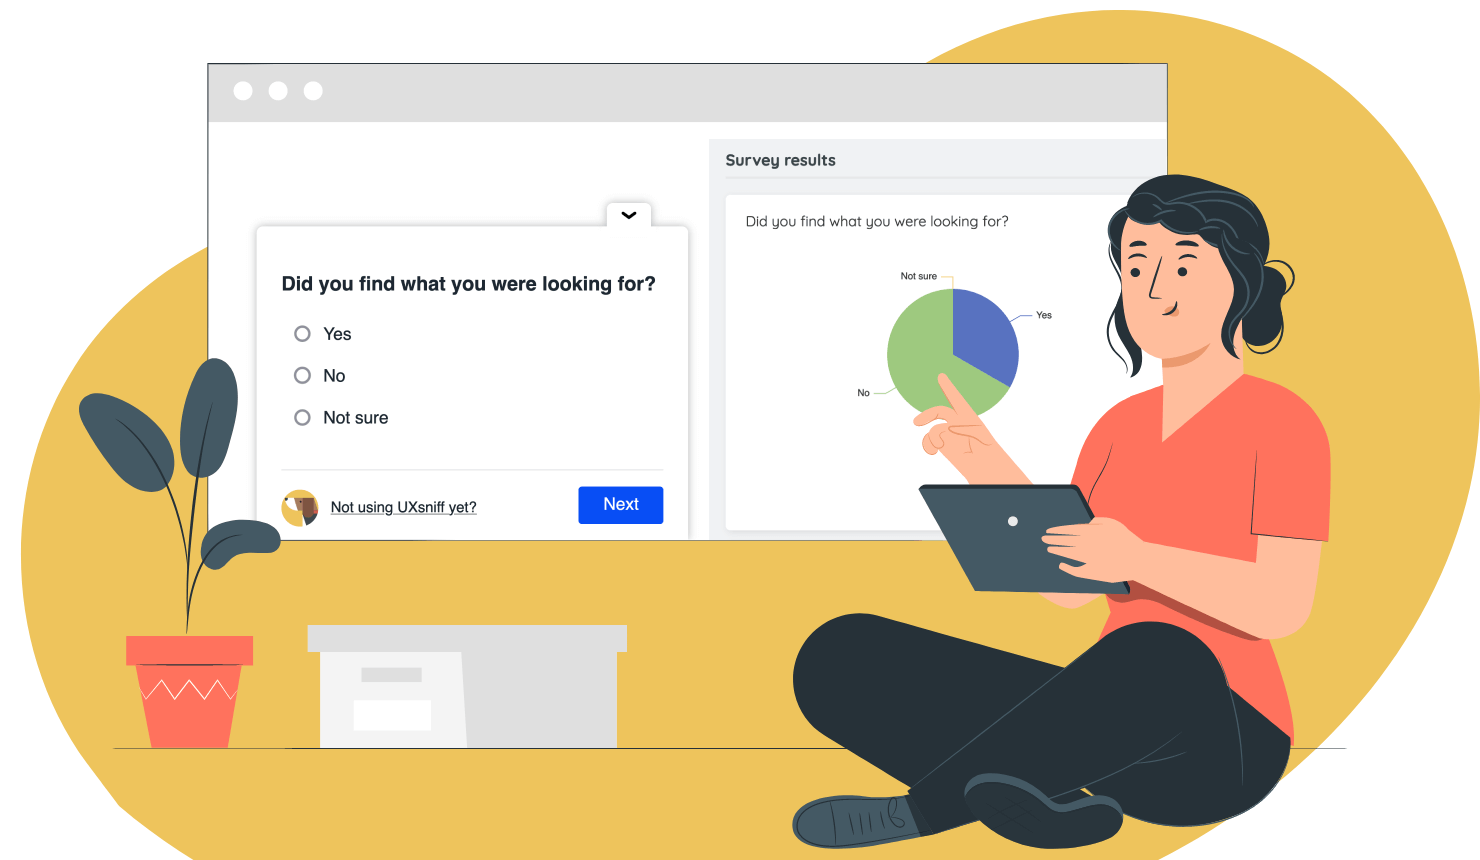
A simple example would be asking users if they found what they were looking for and analyzing the survey results.
Source: UXsniff
The key to using on-site surveys effectively is keeping them short and sweet and ensuring that they don’t disrupt the user flow.
Qualitative Methods of UX Analysis
Qualitative data is less numbers-based than quantitative data and is more focused on using UX analytics tools to gain direct insight from the customer.
Direct Customer Feedback
One of the best, most direct ways to learn more about the user experience is to get direct feedback via customer support.
Whether it’s a complaint, a question, or any other type of inquiry, recording customer feedback is an excellent way to gain insight so you’ll know firsthand what improvements need to be made, as well as what you’re doing right.
Therefore, direct customer feedback is definitely something we suggest integrating into your customer experience analytics toolbox.
Focus Groups
A focus group typically consists of a small group of 5-10 participants who have used your product.

Source: Qualtrics
After that, a moderator leads a discussion to identify the strengths and weaknesses of your product. From this conversation, the moderator can identify specific pain points, along with which aspects of your product users enjoy.
Similar to direct customer feedback, this is a straightforward way of gathering UX data, which can go a long way in enhancing product design and the customer experience long-term.
Usability Testing
This is where you assess UX by testing it on real users and observing how they interact with it.
For example, with usability testing, you would have someone use your website, app, or SaaS product and monitor how they use it in real time.

Source: Usability Geek
Like a focus group, this also involves a moderator. But rather than asking users what they think about the UX, usability testing observes their experience directly.
So in terms of generating unbiased feedback on user behavior, usability testing is one of the best.
Session Recordings
With session recordings, you record real user sessions to track their behavioral flow, which can be replayed and analyzed to observe the entire user journey from start to finish.
Some specific engagements you can analyze include scrolling, clicks, taps, pages viewed, pages not viewed, and pages exited.
After analyzing session recordings and analyzing this qualitative data, you can spot common UX issues involving navigation, accessibility, and functionality so you can diagnose what needs to be fixed to improve user experience.
Diary Studies
This form of user behavior analytics works just like it sounds.
You have users write diary entries after using your product over a period of time. Then, you analyze the user interaction results to look for UX trends and patterns.
One of the main benefits of diary stories is that you can monitor qualitative user feedback over an extended period rather than during just a single session.
Put it All Together
Combining quantitative and qualitative data with UX analytics is the ultimate one-two punch.
Quantitative methods focus on what the specific issues and strengths of your product are and assign them numerical values.
Qualitative methods, on the other hand, focus on the why and how of those issues and strengths and allow you to understand how they impact user activity.
By leveraging both methods, you can gain a bird’s-eye view to see the whole picture. In turn, you can ensure you make the right adjustments to your product.
And as we mentioned earlier, this sets the stage for better UX design, increased conversions, more product usage, increased customer retention, stronger brand loyalty, and more.
Just note that the key to putting everything together coherently is efficiently combining multiple customer data sources — something that can be done by:
Standardizing analytics data through streamlined data integration (e.g. using a UX analytics tool that integrates with numerous platforms) Placing data in a centralized repository Using visualization for intuitive data analysis and reporting
This brings us to our next point — using the right UX analytics in your tech stack.
Common UX Analysis Tools
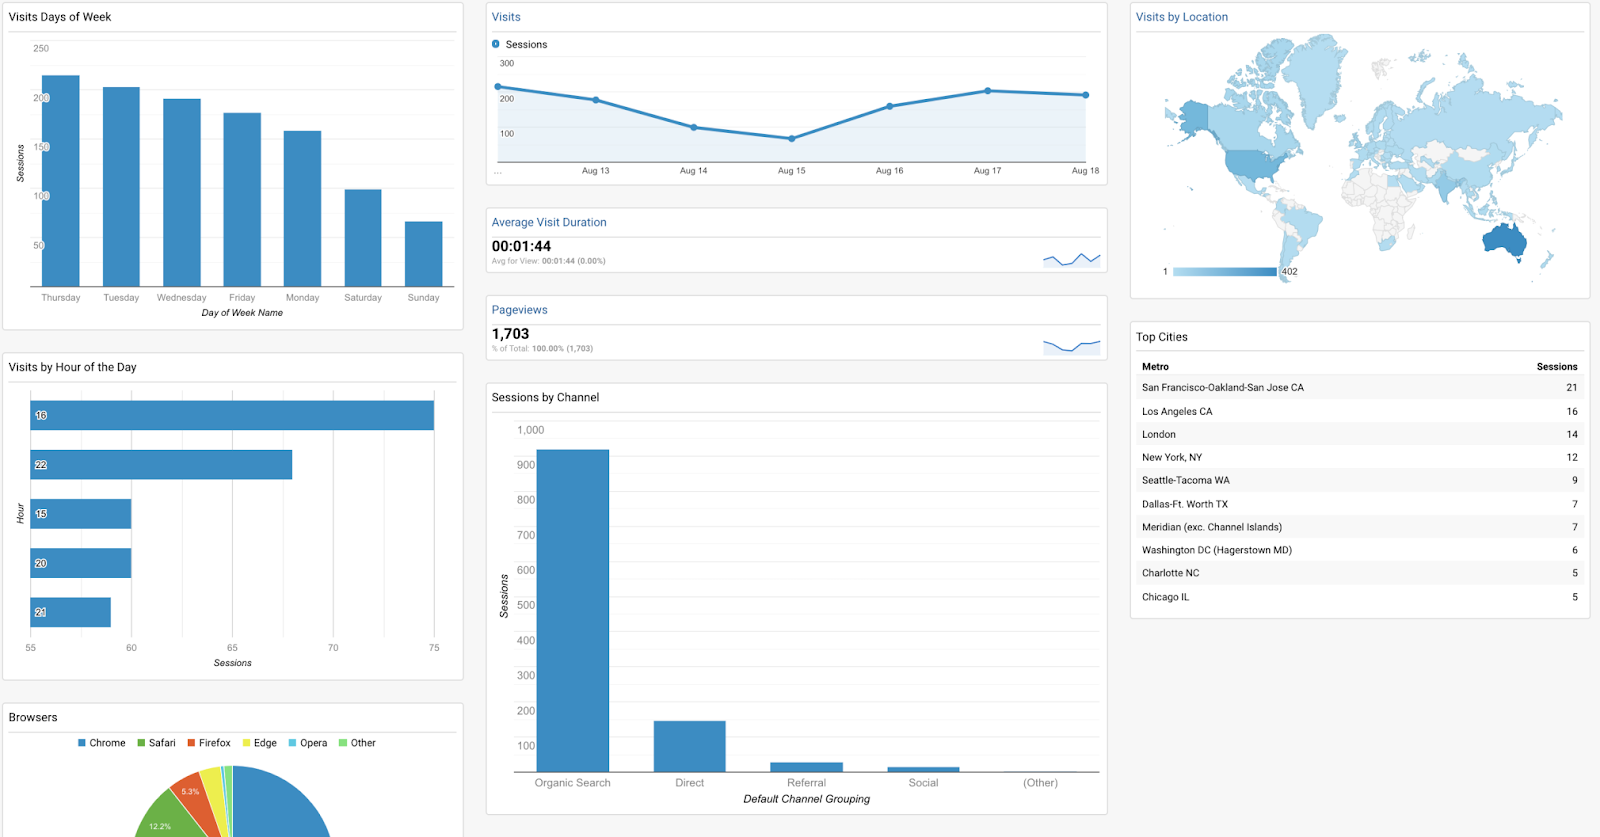
One of the most popular web analytics platforms is Google Analytics, which provides an overview of the basics, such as where your visitors are coming from, how long they spend on your site, the pages they’re looking at, where they’re exiting, and so on.
Source: SEMrush
While Google Analytics isn’t as detailed as some other platforms, it serves as a good starting point for UX analytics and can work well for many smaller businesses.
For product data analytics, Woopra offers end-to-end data, which allows you to track the entire customer journey, how users interact with your product, areas of friction, user trends, retention, and much more.
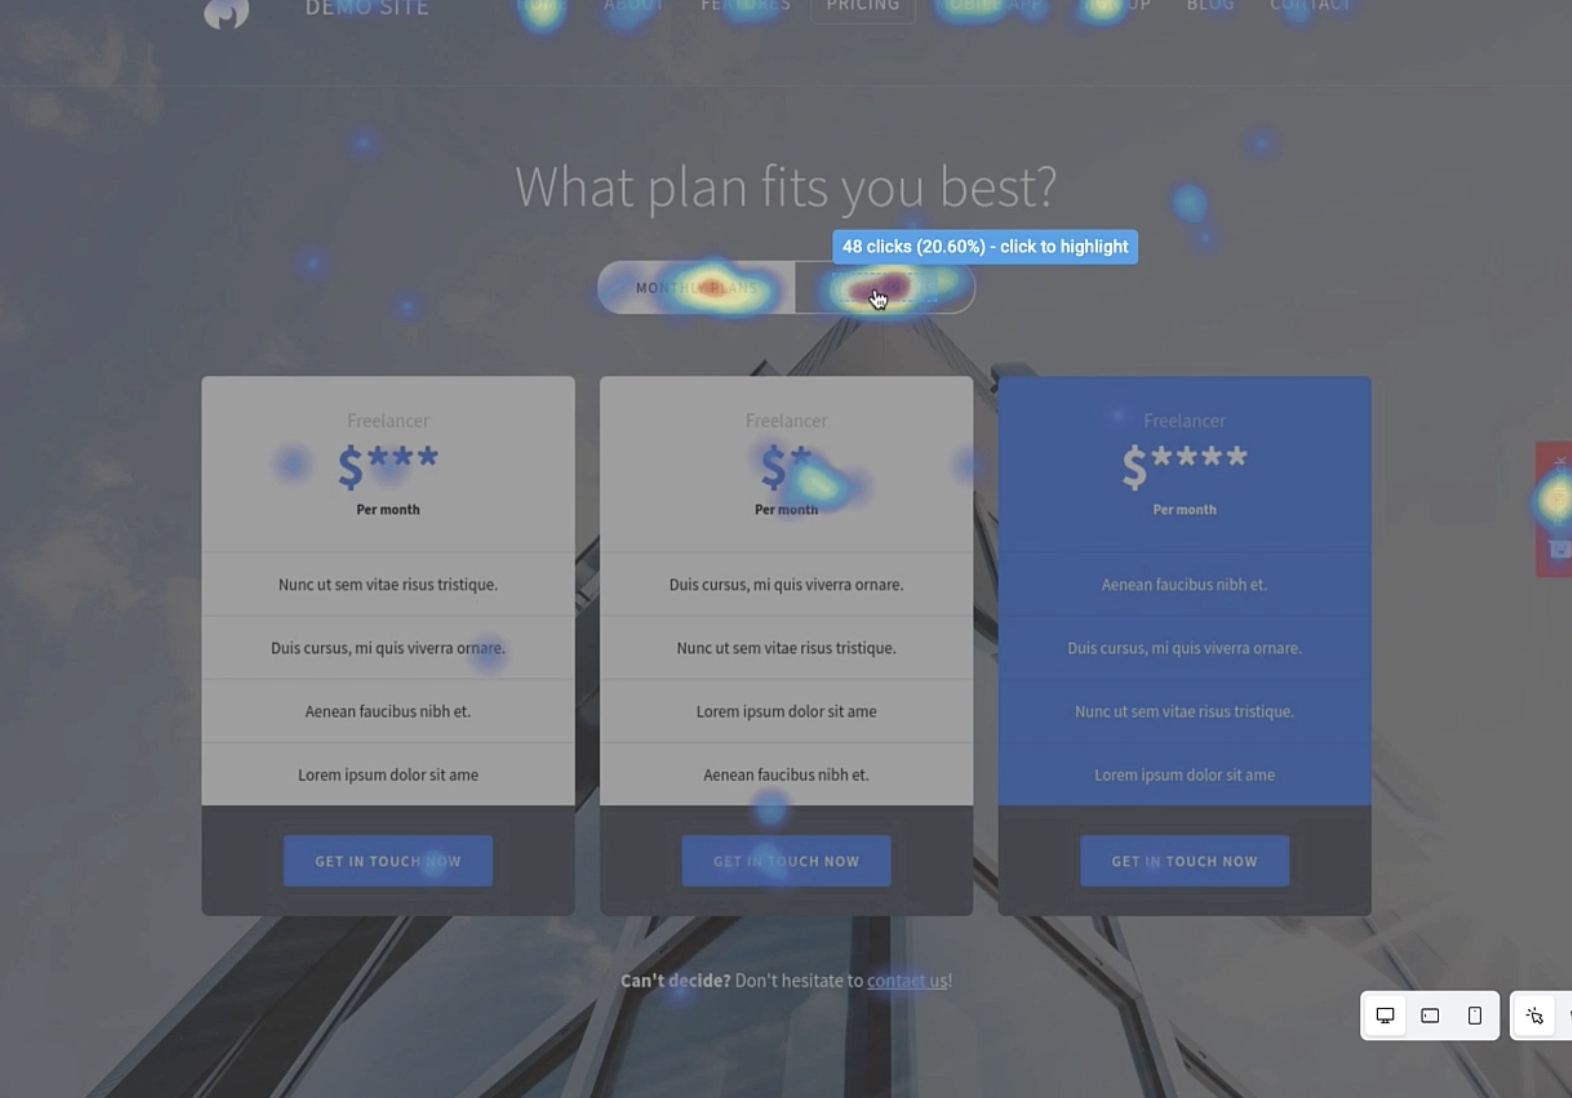
For heatmaps, some of the top tools include Crazy Egg and Hotjar, which are perfect for visualizing user behavior as a UX metric.
Source: Hotjar
For A/B testing, Optimizely is a popular choice and offers simple yet robust testing to help you refine virtually every aspect of the user experience.
And for on-site surveys, there’s Qualoroo, which offers a wide array of templates to conveniently ask UX questions.
When it comes to direct customer feedback, usually the best way to get this is by going directly through customer support.
Focus groups and usability testing can both be done by assigning a moderator.
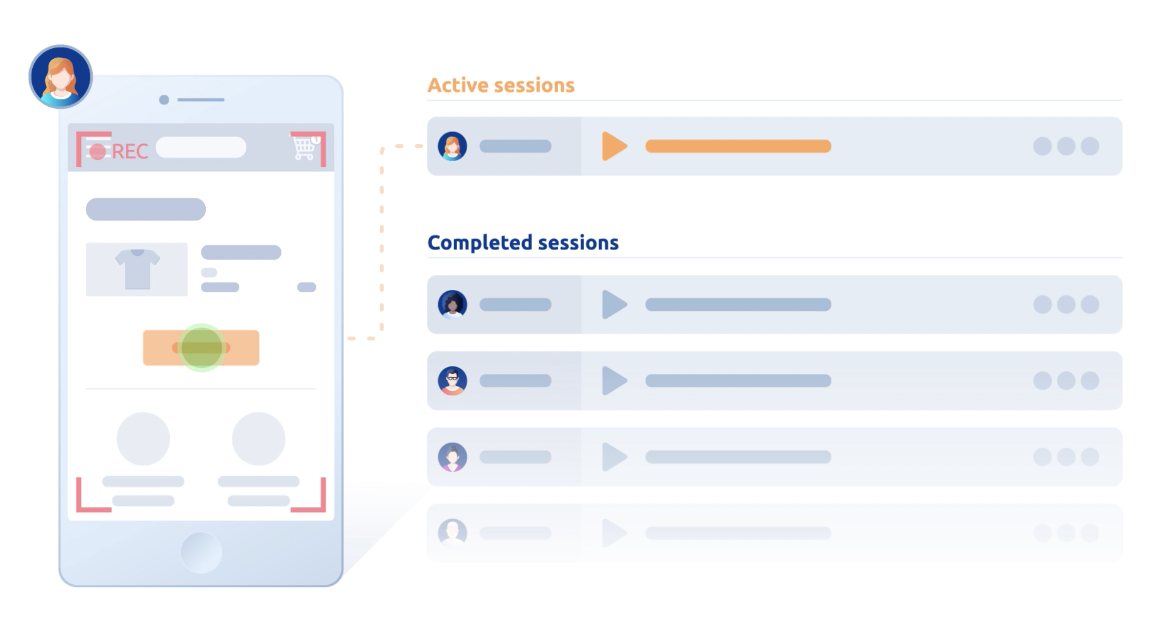
Smartlook is one of the better session recording tools and helps you see what users do on your website or app and what’s confusing them.
Source: Smartlook
And Indeemo is a diary study tool that “helps you research in-the-moment needs, behaviors, journeys, and experiences in any context.”
Analyze Your UX with Woopra
Again, a critical part of properly leveraging user analytics is combining multiple data sources.
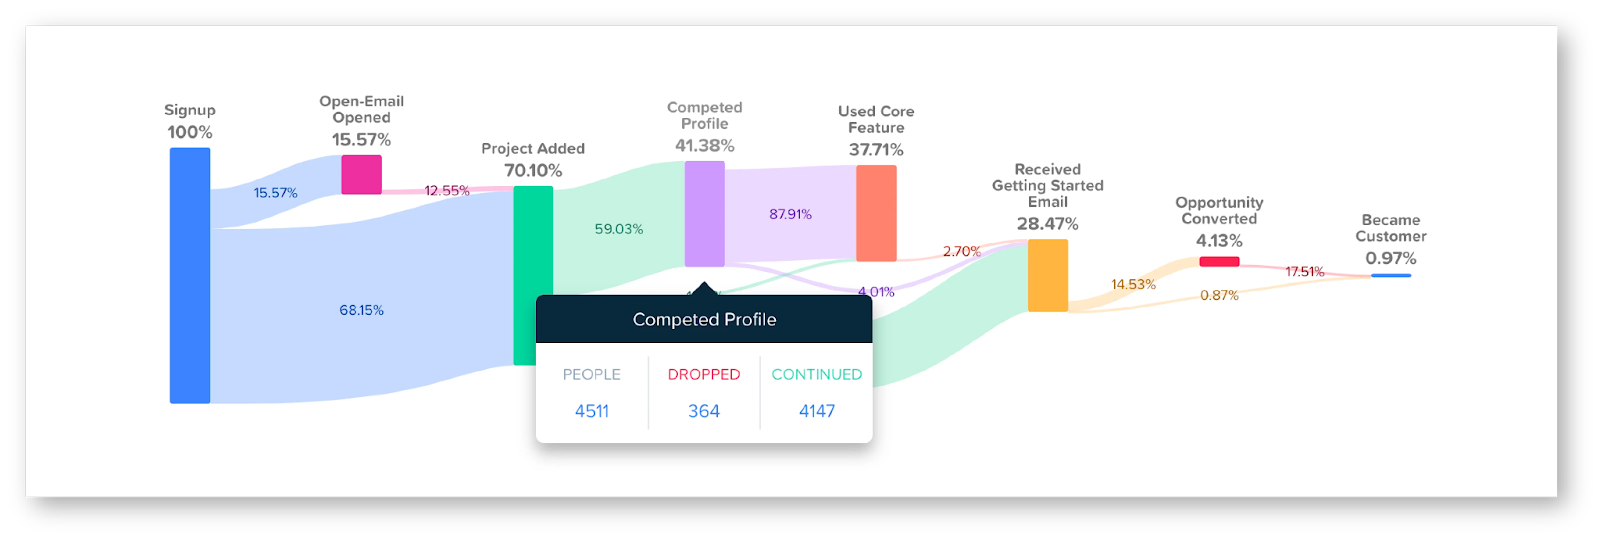
One of the best overall tools for doing that is Woopra, which helps you visualize and optimize every touchpoint in the collective user experience.
From the initial signup to completing a profile to using a core feature to officially becoming a customer and beyond, Woopra gives you a clear understanding so you can identify obstacles and opportunities.
Source: Woopra
While a basic UX analytics platform like Google Analytics offers helpful data for a baseline understanding, Woopra goes far beyond to help you see the big picture.
And because Woopra integrates with many other platforms like Salesforce, Shopify, HubSpot, and Pardot, you can efficiently combine data sources to make sense of everything.


